USA
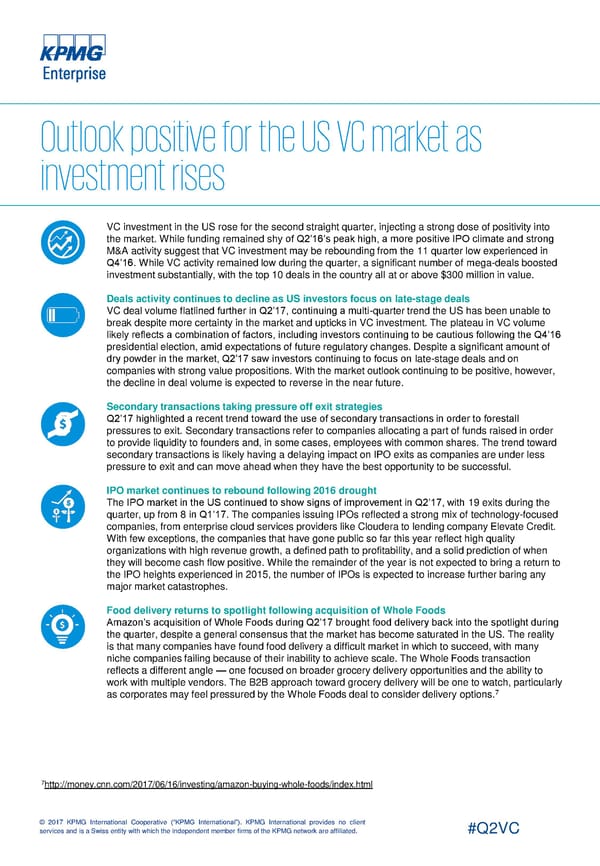
Outlook positive for the US VC market as investments rise
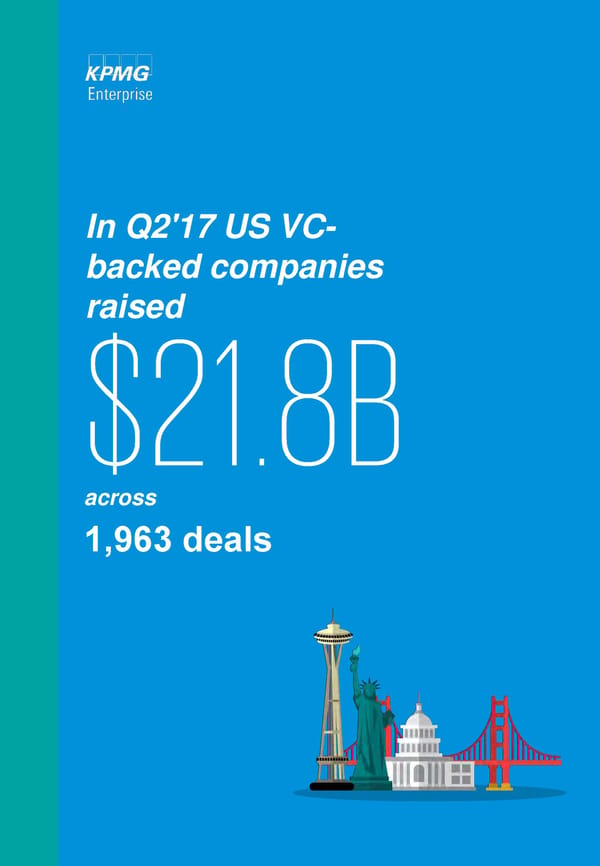
In Q2'17 US VC- backed companies raised across 1,963 deals
VC investment in the US rose for the second straight quarter, injecting a strong dose of positivity into the market. While funding remained shy of Q2’16’s peak high, a more positive IPO climate and strong M&A activity suggest that VC investment may be rebounding from the 11 quarter low experienced in Q4’16. While VC activity remained low during the quarter, a significant number of mega-deals boosted investment substantially, with the top 10 deals in the country all at or above $300 million in value. Deals activity continues to decline as US investors focus on late-stage deals VC deal volume flatlined further in Q2’17, continuing a multi-quarter trend the US has been unable to break despite more certainty in the market and upticks in VC investment. The plateau in VC volume likely reflects a combination of factors, including investors continuing to be cautious following the Q4’16 presidential election, amid expectations of future regulatory changes. Despite a significant amount of dry powder in the market, Q2’17 saw investors continuing to focus on late-stage deals and on companies with strong value propositions. With the market outlook continuing to be positive, however, the decline in deal volume is expected to reverse in the near future. Secondary transactions taking pressure off exit strategies Q2’17 highlighted a recent trend toward the use of secondary transactions in order to forestall pressures to exit. Secondary transactions refer to companies allocating a part of funds raised in order to provide liquidity to founders and, in some cases, employees with common shares. The trend toward secondary transactions is likely having a delaying impact on IPO exits as companies are under less pressure to exit and can move ahead when they have the best opportunity to be successful. IPO market continues to rebound following 2016 drought The IPO market in the US continued to show signs of improvement in Q2’17, with 19 exits during the quarter, up from 8 in Q1’17. The companies issuing IPOs reflected a strong mix of technology-focused companies, from enterprise cloud services providers like Cloudera to lending company Elevate Credit. With few exceptions, the companies that have gone public so far this year reflect high quality organizations with high revenue growth, a defined path to profitability, and a solid prediction of when they will become cash flow positive. While the remainder of the year is not expected to bring a return to the IPO heights experienced in 2015, the number of IPOs is expected to increase further baring any major market catastrophes. Food delivery returns to spotlight following acquisition of Whole Foods Amazon’s acquisition of Whole Foods during Q2’17 brought food delivery back into the spotlight during the quarter, despite a general consensus that the market has become saturated in the US. The reality is that many companies have found food delivery a difficult market in which to succeed, with many niche companies failing because of their inability to achieve scale. The Whole Foods transaction reflects a different angle — one focused on broader grocery delivery opportunities and the ability to work with multiple vendors. The B2B approach toward grocery delivery will be one to watch, particularly as corporates may feel pressured by the Whole Foods deal to consider delivery options.7 7 http://money.cnn.com/2017/06/16/investing/amazon-buying-whole-foods/index.html © 2017 KPMG International Cooperative (“KPMG International”). KPMG International provides no client services and is a Swiss entity with which the independent member firms of the KPMG network are affiliated. #Q2VC
Diversity of offerings continues to fuel growth for healthtech Healthtech continued to be a hot area for investment in the US during Q2’17, with a myriad of companies raising funds — including medical device company Guardian health, radiology services company Radiology Partners, medical platform company Outcome Health and insurance company Clover. Between the immense spending on healthcare in the US and the variety of healthtech options, investments in this space are not expected to drop off anytime soon. Trends to watch for in the US Looking ahead, AI is expected to become a very hot sector for investment in the US over the next 12 months, with technologies that enable machines, computers or platforms to make decisions at a significantly quicker pace than humans continuing to attract significant levels of funding. Blockchain investments are also expected to grow as both traditional VC investors and corporates begin to recognize that the technology’s applicability goes far beyond banking and insurance. © 2017 KPMG International Cooperative (“KPMG International”). KPMG International provides no client services and is a Swiss entity with which the independent member firms of the KPMG network are affiliated. #Q2VC
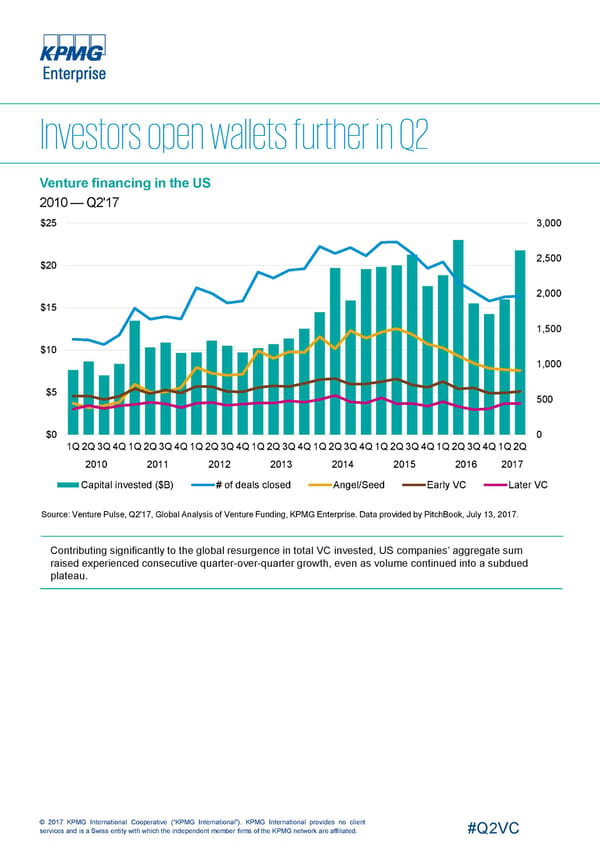
Venture financing in the US 2010 —Q2'17 $25 3,000 2,500 $20 2,000 $15 1,500 $10 1,000 $5 500 $0 0 1Q2Q3Q4Q1Q2Q3Q4Q1Q2Q3Q4Q1Q2Q3Q4Q1Q2Q3Q4Q1Q2Q3Q4Q1Q2Q3Q4Q1Q2Q 2010 2011 2012 2013 2014 2015 2016 2017 Capital invested ($B) # of deals closed Angel/Seed Early VC Later VC Source: Venture Pulse, Q2'17, Global Analysis of Venture Funding, KPMG Enterprise. Data provided by PitchBook, July 13, 2017. Contributing significantly to the global resurgence in total VC invested, US companies’ aggregate sum raised experienced consecutive quarter-over-quarter growth, even as volume continued into a subdued plateau. © 2017 KPMG International Cooperative (“KPMG International”). KPMG International provides no client services and is a Swiss entity with which the independent member firms of the KPMG network are affiliated. #Q2VC
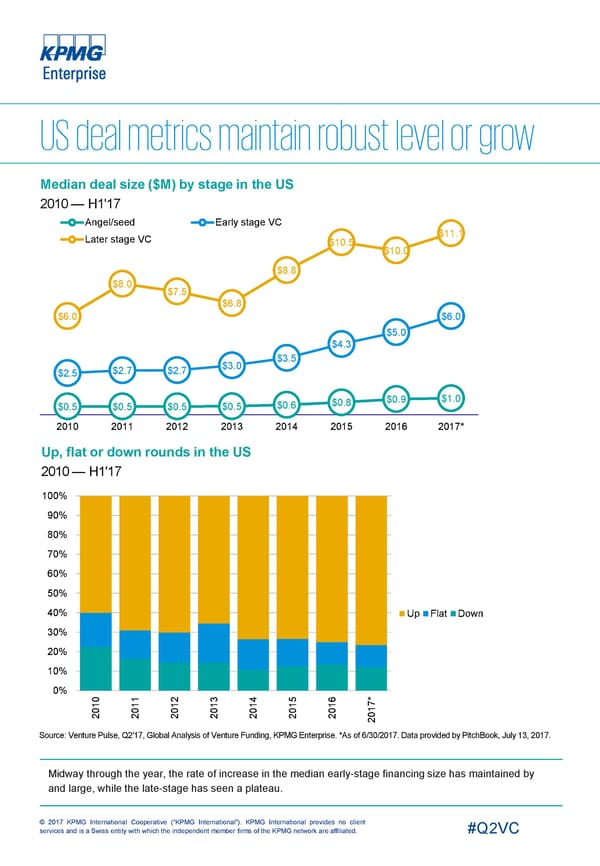
Median deal size ($M) by stage in the US 2010 — H1'17 Angel/seed Early stage VC $11.1 Later stage VC $10.5 $10.0 $8.8 $8.0 $7.5 $6.8 $6.0 $6.0 $5.0 $4.3 $3.5 $3.0 $2.7 $2.7 $2.5 $0.9 $1.0 $0.8 $0.6 $0.5 $0.5 $0.5 $0.5 2010 2011 2012 2013 2014 2015 2016 2017* Up, flat or down rounds in the US 2010 — H1'17 100% 90% 80% 70% 60% 50% 40% Up Flat Down 30% 20% 10% 0% 0 1 2 3 4 5 6 * 1 1 1 1 1 1 1 7 0 0 0 0 0 0 0 1 2 2 2 2 2 2 2 0 2 Source: Venture Pulse, Q2'17, Global Analysis of Venture Funding, KPMG Enterprise. *As of 6/30/2017. Data provided by PitchBook,July 13, 2017. Midway through the year, the rate of increase in the median early-stage financing size has maintained by and large, while the late-stage has seen a plateau. © 2017 KPMG International Cooperative (“KPMG International”). KPMG International provides no client services and is a Swiss entity with which the independent member firms of the KPMG network are affiliated. #Q2VC
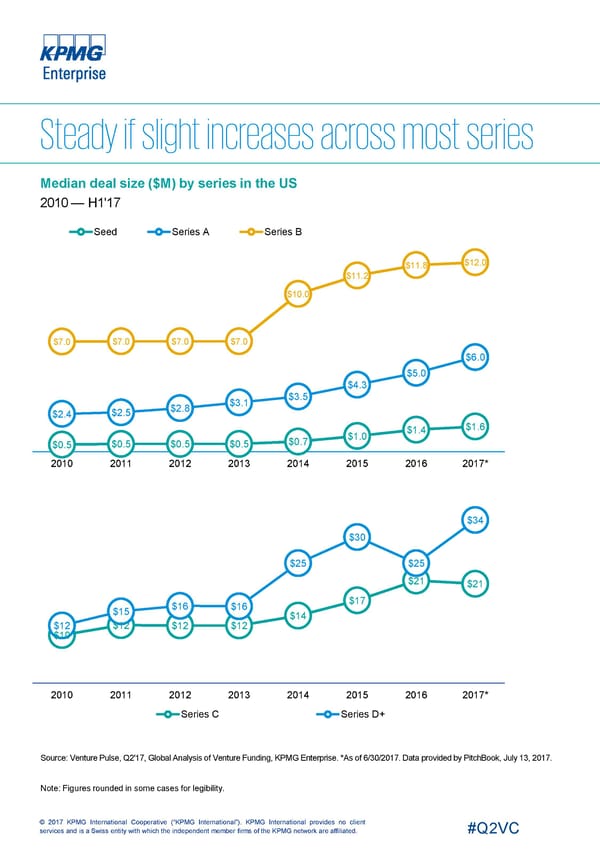
Median deal size ($M) by series in the US 2010 — H1'17 Seed Series A Series B $12.0 $11.8 $11.2 $10.0 $7.0 $7.0 $7.0 $7.0 $6.0 $5.0 $4.3 $3.5 $3.1 $2.8 $2.5 $2.4 $1.6 $1.4 $1.0 $0.7 $0.5 $0.5 $0.5 $0.5 2010 2011 2012 2013 2014 2015 2016 2017* $34 $30 $25 $25 $21 $21 $17 $16 $16 $15 $14 $12 $12 $12 $12 $10 2010 2011 2012 2013 2014 2015 2016 2017* Series C Series D+ Source: Venture Pulse, Q2'17, Global Analysis of Venture Funding, KPMG Enterprise. *As of 6/30/2017. Data provided by PitchBook, July 13, 2017. Note: Figures rounded in some cases for legibility. © 2017 KPMG International Cooperative (“KPMG International”). KPMG International provides no client services and is a Swiss entity with which the independent member firms of the KPMG network are affiliated. #Q2VC
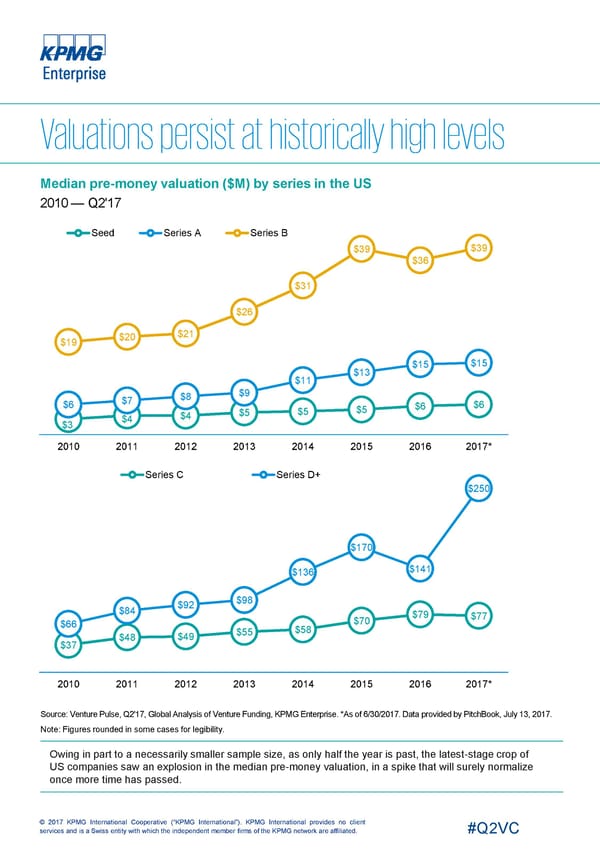
Median pre-money valuation ($M) by series in the US 2010 — Q2'17 Seed Series A Series B $39 $39 $36 $31 $26 $21 $20 $19 $15 $15 $13 $11 $9 $8 $7 $6 $6 $6 $5 $5 $5 $4 $4 $3 2010 2011 2012 2013 2014 2015 2016 2017* Series C Series D+ $250 $170 $141 $136 $98 $92 $84 $79 $77 $70 $66 $58 $55 $48 $49 $37 2010 2011 2012 2013 2014 2015 2016 2017* Source: Venture Pulse, Q2'17, Global Analysis of Venture Funding, KPMG Enterprise. *As of 6/30/2017. Data provided by PitchBook, July 13, 2017. Note: Figures rounded in some cases for legibility. Owing in part to a necessarily smaller sample size, as only half the year is past, the latest-stage crop of US companies saw an explosion in the median pre-money valuation, in a spike that will surely normalize once more time has passed. © 2017 KPMG International Cooperative (“KPMG International”). KPMG International provides no client services and is a Swiss entity with which the independent member firms of the KPMG network are affiliated. #Q2VC
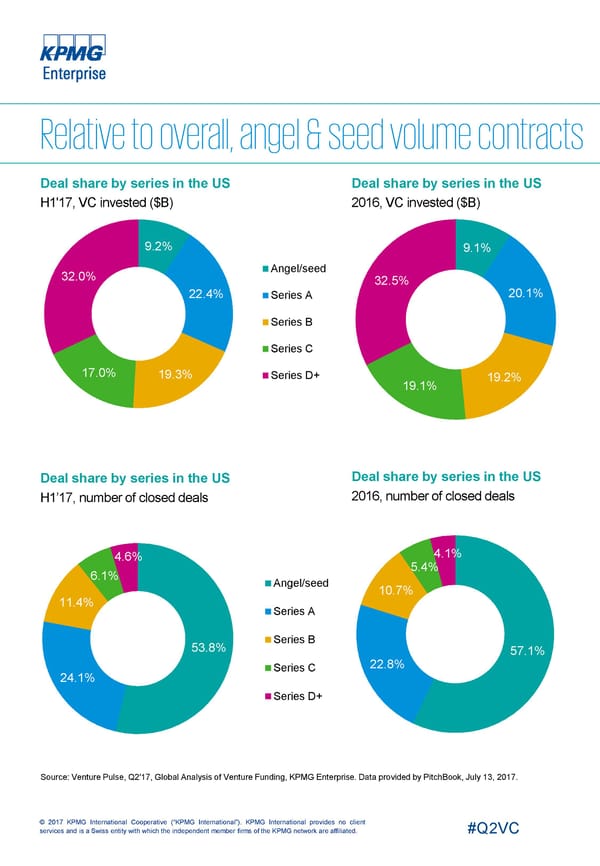
Deal share by series in the US Deal share by series in the US H1'17, VC invested ($B) 2016, VC invested ($B) 9.2% 9.1% Angel/seed 32.0% 32.5% 22.4% 20.1% Series A Series B Series C 17.0% 19.3% Series D+ 19.2% 19.1% Deal share by series in the US Deal share by series in the US 2016, number of closed deals H1’17, number of closed deals 4.1% 4.6% 5.4% 6.1% Angel/seed 10.7% 11.4% Series A Series B 53.8% 57.1% 22.8% Series C 24.1% Series D+ Source: Venture Pulse, Q2'17, Global Analysis of Venture Funding, KPMG Enterprise. Data provided by PitchBook, July 13, 2017. © 2017 KPMG International Cooperative (“KPMG International”). KPMG International provides no client services and is a Swiss entity with which the independent member firms of the KPMG network are affiliated. #Q2VC
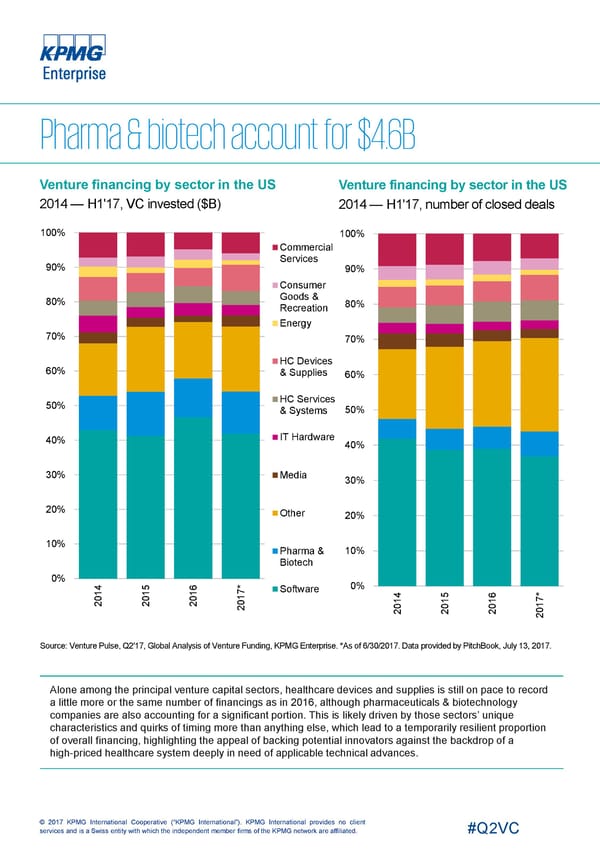
Venture financing by sector in the US Venture financing by sector in the US 2014 — H1'17, VC invested ($B) 2014 — H1'17, number of closed deals 100% 100% Commercial Services 90% 90% Consumer Goods & 80% 80% Recreation Energy 70% 70% HC Devices 60% & Supplies 60% HC Services 50% & Systems 50% IT Hardware 40% 40% 30% Media 30% 20% Other 20% 10% Pharma & 10% Biotech 0% 4 5 6 * 0% 7 Software 1 1 1 4 5 6 * 0 0 0 1 7 0 1 1 1 2 2 2 0 0 0 1 2 0 2 2 2 2 Source: Venture Pulse, Q2'17, Global Analysis of Venture Funding, KPMG Enterprise. *As of 6/30/2017. Data provided by PitchBook, July 13, 2017. Alone among the principal venture capital sectors, healthcare devices and supplies is still on pace to record a little more or the same number of financings as in 2016, although pharmaceuticals & biotechnology companies are also accounting for a significant portion. This is likely driven by those sectors’ unique characteristics and quirks of timing more than anything else, which lead to a temporarily resilient proportion of overall financing, highlighting the appeal of backing potential innovators against the backdrop of a high-priced healthcare system deeply in need of applicable technical advances. © 2017 KPMG International Cooperative (“KPMG International”). KPMG International provides no client services and is a Swiss entity with which the independent member firms of the KPMG network are affiliated. #Q2VC
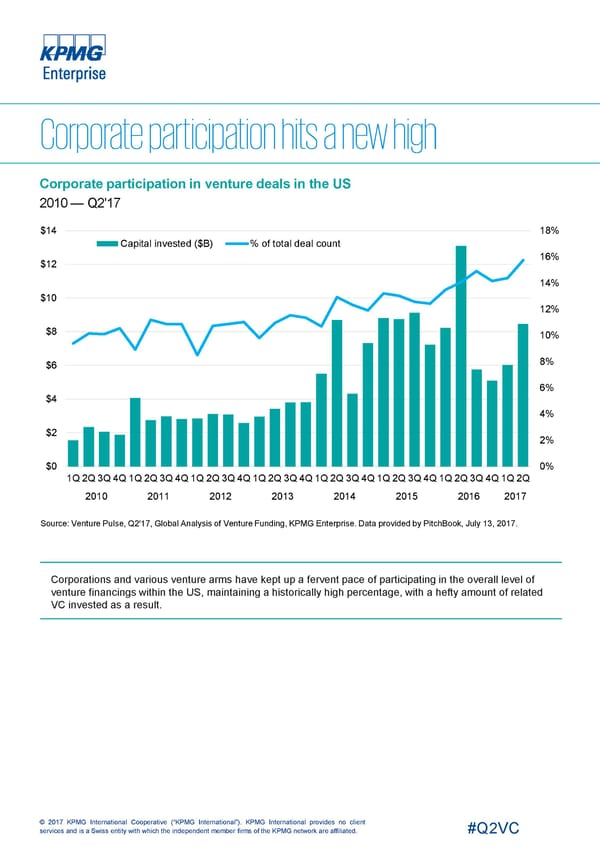
Corporate participation in venture deals in the US 2010 — Q2'17 $14 18% Capital invested ($B) % of total deal count 16% $12 14% $10 12% $8 10% 8% $6 6% $4 4% $2 2% $0 0% 1Q2Q3Q4Q1Q2Q3Q4Q1Q2Q3Q4Q1Q2Q3Q4Q1Q2Q3Q4Q1Q2Q3Q4Q1Q2Q3Q4Q1Q2Q 2010 2011 2012 2013 2014 2015 2016 2017 Source: Venture Pulse, Q2'17, Global Analysis of Venture Funding, KPMG Enterprise. Data provided by PitchBook, July 13, 2017. Corporations and various venture arms have kept up a fervent pace of participating in the overall level of venture financings within the US, maintaining a historically high percentage, with a hefty amount of related VC invested as a result. © 2017 KPMG International Cooperative (“KPMG International”). KPMG International provides no client services and is a Swiss entity with which the independent member firms of the KPMG network are affiliated. #Q2VC
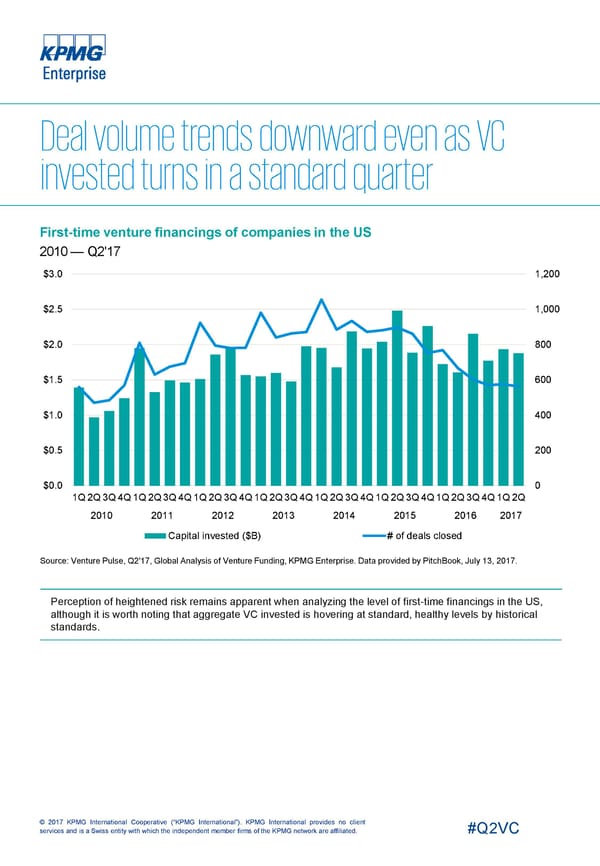
First-time venture financings of companies in the US 2010 — Q2'17 $3.0 1,200 $2.5 1,000 $2.0 800 $1.5 600 $1.0 400 $0.5 200 $0.0 0 1Q2Q3Q4Q1Q2Q3Q4Q1Q2Q3Q4Q1Q2Q3Q4Q1Q2Q3Q4Q1Q2Q3Q4Q1Q2Q3Q4Q1Q2Q 2010 2011 2012 2013 2014 2015 2016 2017 Capital invested ($B) # of deals closed Source: Venture Pulse, Q2'17, Global Analysis of Venture Funding, KPMG Enterprise. Data provided by PitchBook, July 13, 2017. Perception of heightened risk remains apparent when analyzing the level of first-time financings in the US, although it is worth noting that aggregate VC invested is hovering at standard, healthy levels by historical standards. © 2017 KPMG International Cooperative (“KPMG International”). KPMG International provides no client services and is a Swiss entity with which the independent member firms of the KPMG network are affiliated. #Q2VC
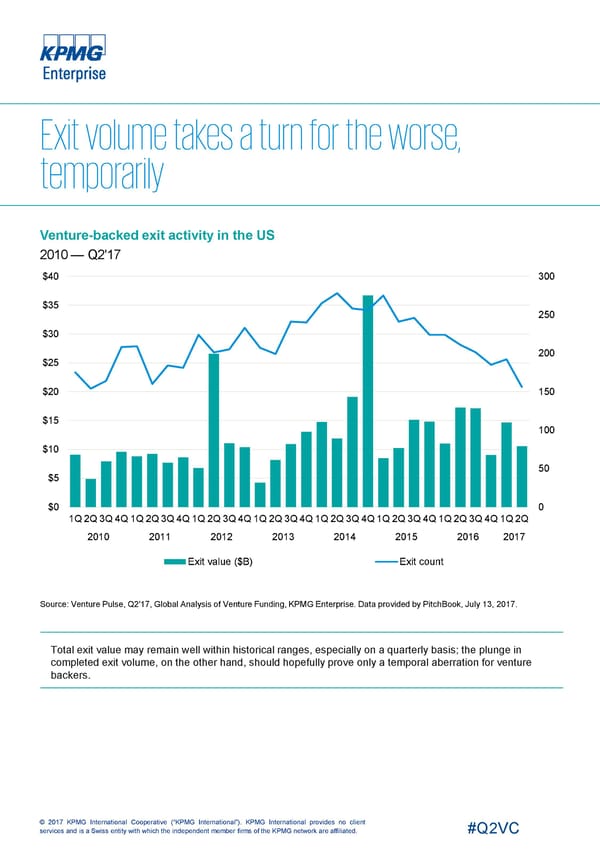
Venture-backed exit activity in the US 2010 — Q2'17 $40 300 $35 250 $30 200 $25 $20 150 $15 100 $10 50 $5 $0 0 1Q2Q3Q4Q1Q2Q3Q4Q1Q2Q3Q4Q1Q2Q3Q4Q1Q2Q3Q4Q1Q2Q3Q4Q1Q2Q3Q4Q1Q2Q 2010 2011 2012 2013 2014 2015 2016 2017 Exit value ($B) Exit count Source: Venture Pulse, Q2'17, Global Analysis of Venture Funding, KPMG Enterprise. Data provided by PitchBook, July 13, 2017. Total exit value may remain well within historical ranges, especially on a quarterly basis; the plunge in completed exit volume, on the other hand, should hopefully prove only a temporal aberration for venture backers. © 2017 KPMG International Cooperative (“KPMG International”). KPMG International provides no client services and is a Swiss entity with which the independent member firms of the KPMG network are affiliated. #Q2VC
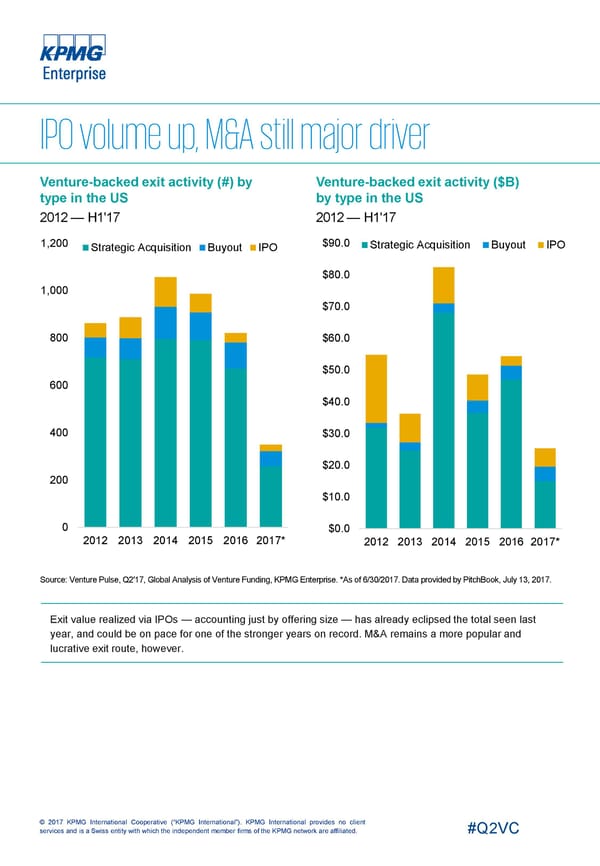
Venture-backed exit activity (#) by Venture-backed exit activity ($B) type in the US by type in the US 2012 — H1'17 2012 — H1'17 1,200 $90.0 Strategic Acquisition Buyout IPO Strategic Acquisition Buyout IPO $80.0 1,000 $70.0 800 $60.0 $50.0 600 $40.0 400 $30.0 $20.0 200 $10.0 0 $0.0 2012 2013 2014 2015 2016 2017* 2012 2013 2014 2015 2016 2017* Source: Venture Pulse, Q2'17, Global Analysis of Venture Funding, KPMG Enterprise. *As of 6/30/2017. Data provided by PitchBook, July 13, 2017. Exit value realized via IPOs — accounting just by offering size — has already eclipsed the total seen last year, and could be on pace for one of the stronger years on record. M&A remains a more popular and lucrative exit route, however. © 2017 KPMG International Cooperative (“KPMG International”). KPMG International provides no client services and is a Swiss entity with which the independent member firms of the KPMG network are affiliated. #Q2VC
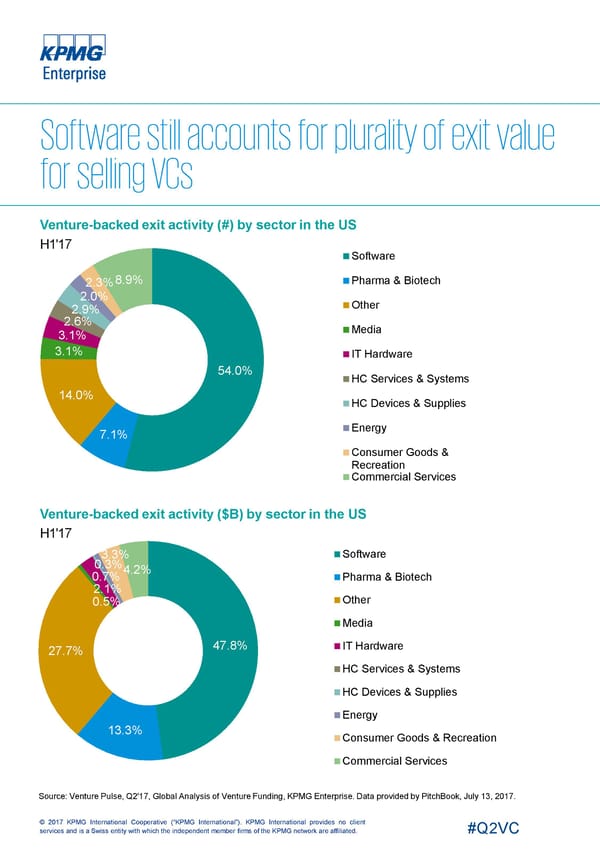
Venture-backed exit activity (#) by sector in the US H1'17 Software 8.9% Pharma & Biotech 2.3% 2.0% Other 2.9% 2.6% Media 3.1% 3.1% IT Hardware 54.0% HC Services & Systems 14.0% HC Devices & Supplies Energy 7.1% Consumer Goods & Recreation Commercial Services Venture-backed exit activity ($B) by sector in the US H1'17 3.3% Software 0.3% 4.2% 0.7% Pharma & Biotech 2.1% Other 0.5% Media 47.8% IT Hardware 27.7% HC Services & Systems HC Devices & Supplies Energy 13.3% Consumer Goods & Recreation Commercial Services Source: Venture Pulse, Q2'17, Global Analysis of Venture Funding, KPMG Enterprise. Data provided by PitchBook, July 13, 2017. © 2017 KPMG International Cooperative (“KPMG International”). KPMG International provides no client services and is a Swiss entity with which the independent member firms of the KPMG network are affiliated. #Q2VC
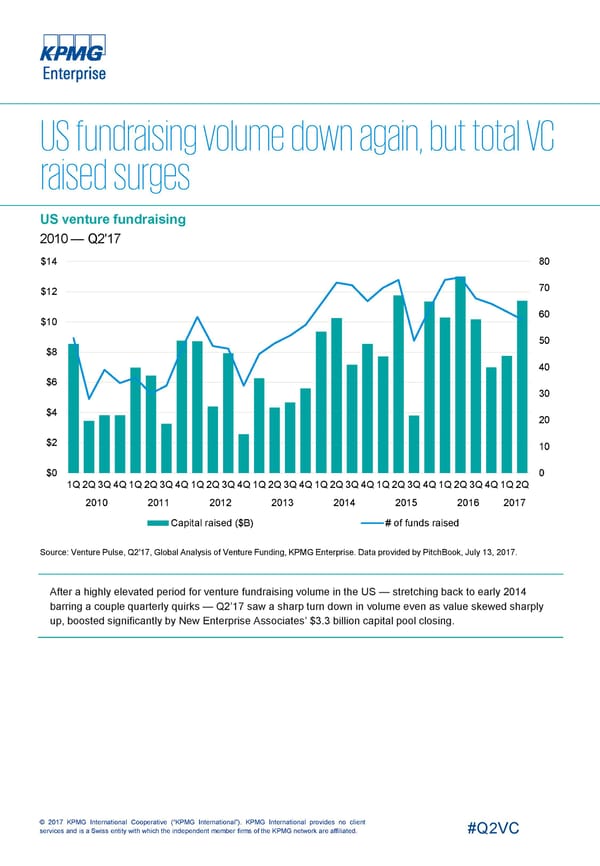
US venture fundraising 2010 — Q2'17 $14 80 70 $12 60 $10 50 $8 40 $6 30 $4 20 $2 10 $0 0 1Q2Q3Q4Q1Q2Q3Q4Q1Q2Q3Q4Q1Q2Q3Q4Q1Q2Q3Q4Q1Q2Q3Q4Q1Q2Q3Q4Q1Q2Q 2010 2011 2012 2013 2014 2015 2016 2017 Capital raised ($B) # of funds raised Source: Venture Pulse, Q2'17, Global Analysis of Venture Funding, KPMG Enterprise. Data provided by PitchBook, July 13, 2017. After a highly elevated period for venture fundraising volume in the US — stretching back to early 2014 barring a couple quarterly quirks — Q2’17 saw a sharp turn down in volume even as value skewed sharply up, boosted significantly by New Enterprise Associates’ $3.3 billion capital pool closing. © 2017 KPMG International Cooperative (“KPMG International”). KPMG International provides no client services and is a Swiss entity with which the independent member firms of the KPMG network are affiliated. #Q2VC
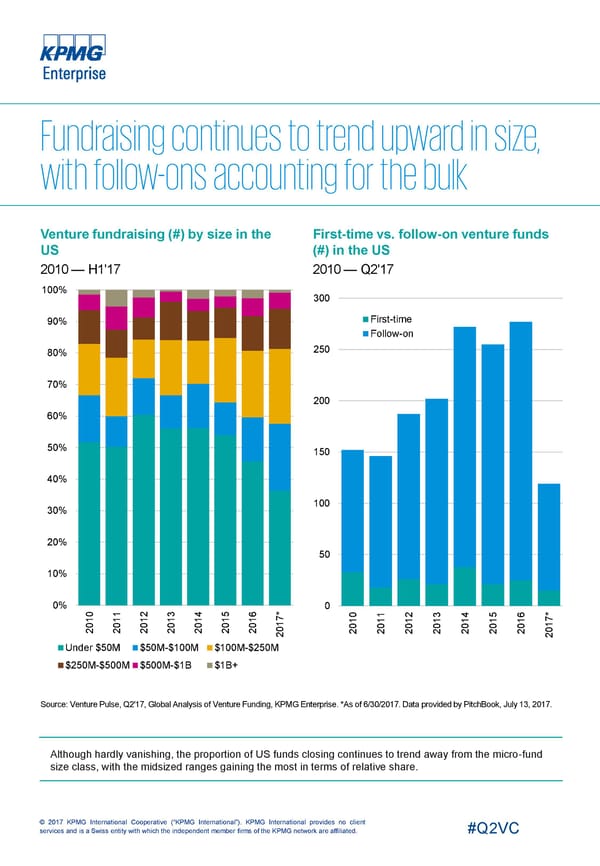
Venture fundraising (#) by size in the First-time vs. follow-on venture funds US (#) in the US 2010 — H1'17 2010 — Q2'17 100% 300 First-time 90% Follow-on 250 80% 70% 200 60% 50% 150 40% 100 30% 20% 50 10% 0% 0 0 1 2 3 4 5 6 * * 0 1 2 3 4 5 6 1 1 1 1 1 1 1 7 7 1 1 1 1 1 1 1 0 0 0 0 0 0 0 1 0 0 0 0 0 0 0 1 2 2 2 2 2 2 2 0 0 2 2 2 2 2 2 2 2 2 Under $50M $50M-$100M $100M-$250M $250M-$500M $500M-$1B $1B+ Source: Venture Pulse, Q2'17, Global Analysis of Venture Funding, KPMG Enterprise. *As of 6/30/2017. Data provided by PitchBook, July 13, 2017. Although hardly vanishing, the proportion of US funds closing continues to trend away from the micro-fund size class, with the midsized ranges gaining the most in terms of relative share. © 2017 KPMG International Cooperative (“KPMG International”). KPMG International provides no client services and is a Swiss entity with which the independent member firms of the KPMG network are affiliated. #Q2VC
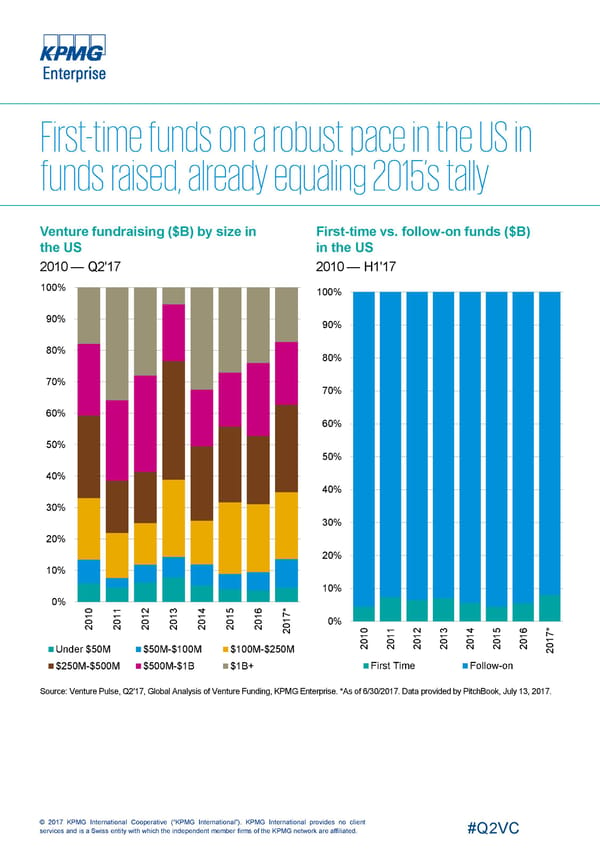
Venture fundraising ($B) by size in First-time vs. follow-on funds ($B) the US in the US 2010 — Q2'17 2010 — H1'17 100% 100% 90% 90% 80% 80% 70% 70% 60% 60% 50% 50% 40% 40% 30% 30% 20% 20% 10% 10% 0% 0 1 2 3 4 5 6 * 1 1 1 1 1 1 1 7 0 0 0 0 0 0 0 1 0% 2 2 2 2 2 2 2 0 0 1 2 3 4 5 6 * 2 1 1 1 1 1 1 1 7 0 0 0 0 0 0 0 1 2 2 2 2 2 2 2 0 Under $50M $50M-$100M $100M-$250M 2 $250M-$500M $500M-$1B $1B+ First Time Follow-on Source: Venture Pulse, Q2'17, Global Analysis of Venture Funding, KPMG Enterprise. *As of 6/30/2017. Data provided by PitchBook, July 13, 2017. © 2017 KPMG International Cooperative (“KPMG International”). KPMG International provides no client services and is a Swiss entity with which the independent member firms of the KPMG network are affiliated. #Q2VC
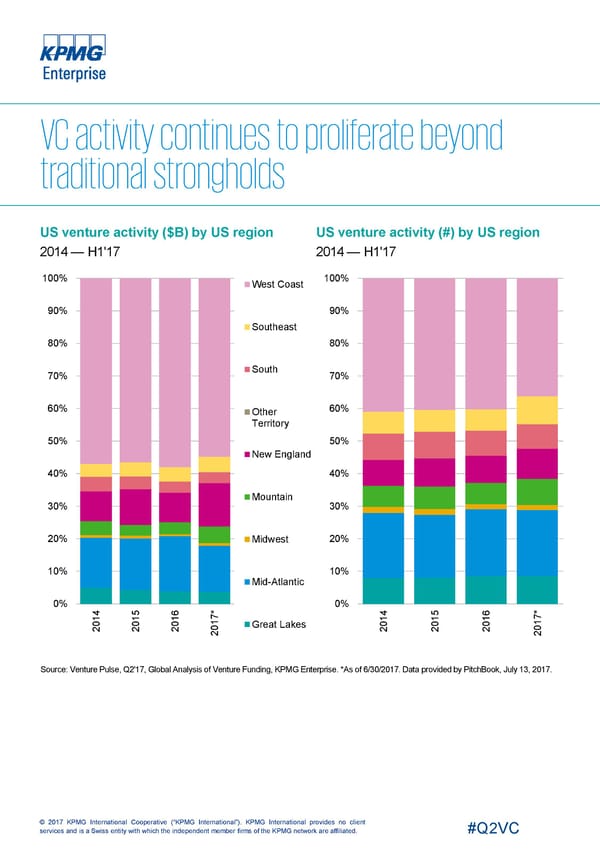
US venture activity ($B) by US region US venture activity (#) by US region 2014 — H1'17 2014 — H1'17 100% 100% West Coast 90% 90% Southeast 80% 80% South 70% 70% 60% 60% Other Territory 50% 50% New England 40% 40% Mountain 30% 30% 20% Midwest 20% 10% 10% Mid-Atlantic 0% 0% 4 5 * 4 5 * 1 1 16 7 1 1 16 7 0 0 1 0 0 1 Great Lakes 2 2 20 0 2 2 20 0 2 2 Source: Venture Pulse, Q2'17, Global Analysis of Venture Funding, KPMG Enterprise. *As of 6/30/2017. Data provided by PitchBook, July 13, 2017. © 2017 KPMG International Cooperative (“KPMG International”). KPMG International provides no client services and is a Swiss entity with which the independent member firms of the KPMG network are affiliated. #Q2VC
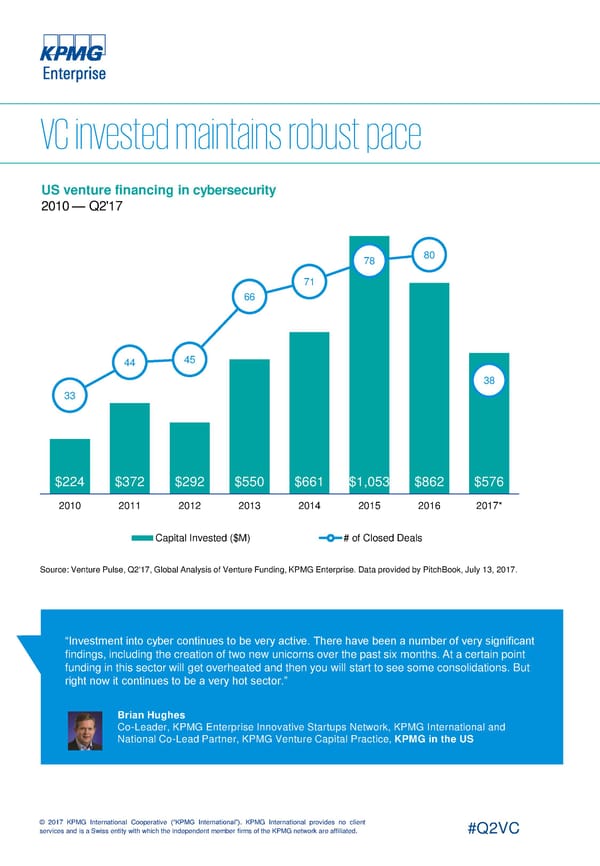
US venture financing in cybersecurity 2010 — Q2'17 78 80 71 66 44 45 38 33 $224 $372 $292 $550 $661 $1,053 $862 $576 2010 2011 2012 2013 2014 2015 2016 2017* Capital Invested ($M) # of Closed Deals Source: Venture Pulse, Q2'17, Global Analysis of Venture Funding, KPMG Enterprise. Data provided by PitchBook, July 13, 2017. “Investment into cyber continues to be very active. There have been a number of very significant findings, including the creation of two new unicorns over the past six months. At a certain point funding in this sector will get overheated and then you will start to see some consolidations. But right now it continues to be a very hot sector.” Brian Hughes Co-Leader, KPMG Enterprise Innovative Startups Network, KPMG International and National Co-Lead Partner, KPMG Venture Capital Practice, KPMG in the US © 2017 KPMG International Cooperative (“KPMG International”). KPMG International provides no client services and is a Swiss entity with which the independent member firms of the KPMG network are affiliated. #Q2VC
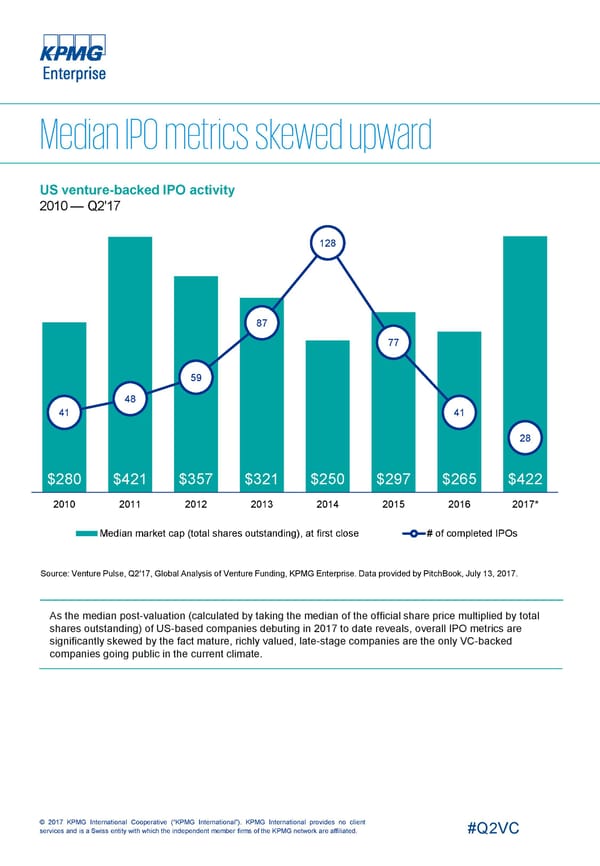
US venture-backed IPO activity 2010 — Q2'17 128 87 77 59 48 41 41 28 $280 $421 $357 $321 $250 $297 $265 $422 2010 2011 2012 2013 2014 2015 2016 2017* Median market cap (total shares outstanding), at first close # of completed IPOs Source: Venture Pulse, Q2'17, Global Analysis of Venture Funding, KPMG Enterprise. Data provided by PitchBook, July 13, 2017. As the median post-valuation (calculated by taking the median of the official share price multiplied by total shares outstanding) of US-based companies debuting in 2017 to date reveals, overall IPO metrics are significantly skewed by the fact mature, richly valued, late-stage companies are the only VC-backed companies going public in the current climate. © 2017 KPMG International Cooperative (“KPMG International”). KPMG International provides no client services and is a Swiss entity with which the independent member firms of the KPMG network are affiliated. #Q2VC
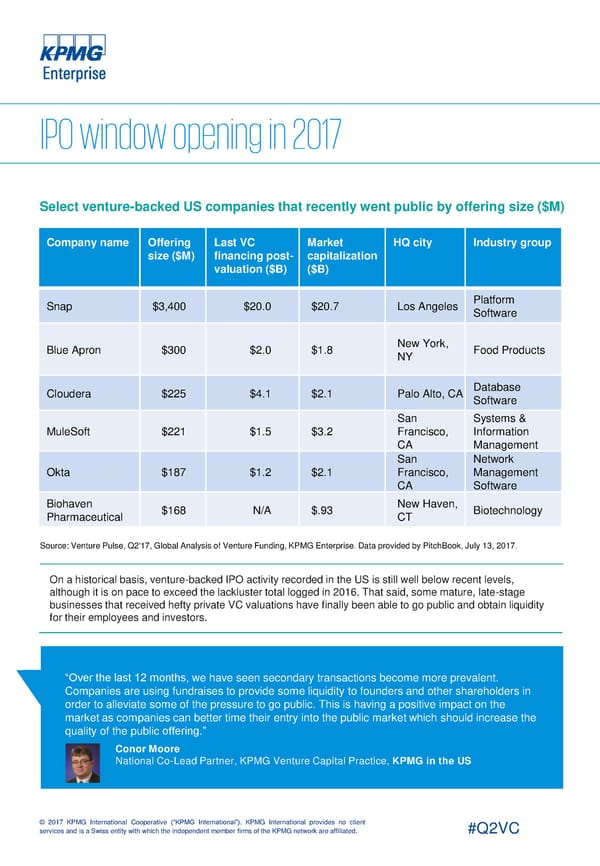
Select venture-backed US companies that recently went public by offering size ($M) Company name Offering Last VC Market HQ city Industry group size ($M) financing post- capitalization valuation ($B) ($B) Snap $3,400 $20.0 $20.7 Los Angeles Platform Software Blue Apron $300 $2.0 $1.8 New York, Food Products NY Cloudera $225 $4.1 $2.1 Palo Alto, CA Database Software San Systems & MuleSoft $221 $1.5 $3.2 Francisco, Information CA Management San Network Okta $187 $1.2 $2.1 Francisco, Management CA Software Biohaven $168 N/A $.93 New Haven, Biotechnology Pharmaceutical CT Source: Venture Pulse, Q2'17, Global Analysis of Venture Funding, KPMG Enterprise. Data provided by PitchBook, July 13, 2017. On a historical basis, venture-backed IPO activity recorded in the US is still well below recent levels, although it is on pace to exceed the lackluster total logged in 2016. That said, some mature, late-stage businesses that received hefty private VC valuations have finally been able to go public and obtain liquidity for their employees and investors. “Over the last 12 months, we have seen secondary transactions become more prevalent. Companies are using fundraises to provide some liquidity to founders and other shareholders in order to alleviate some of the pressure to go public. This is having a positive impact on the market as companies can better time their entry into the public market which should increase the quality of the public offering.” Conor Moore National Co-Lead Partner, KPMG Venture Capital Practice, KPMG in the US © 2017 KPMG International Cooperative (“KPMG International”). KPMG International provides no client services and is a Swiss entity with which the independent member firms of the KPMG network are affiliated. #Q2VC

