
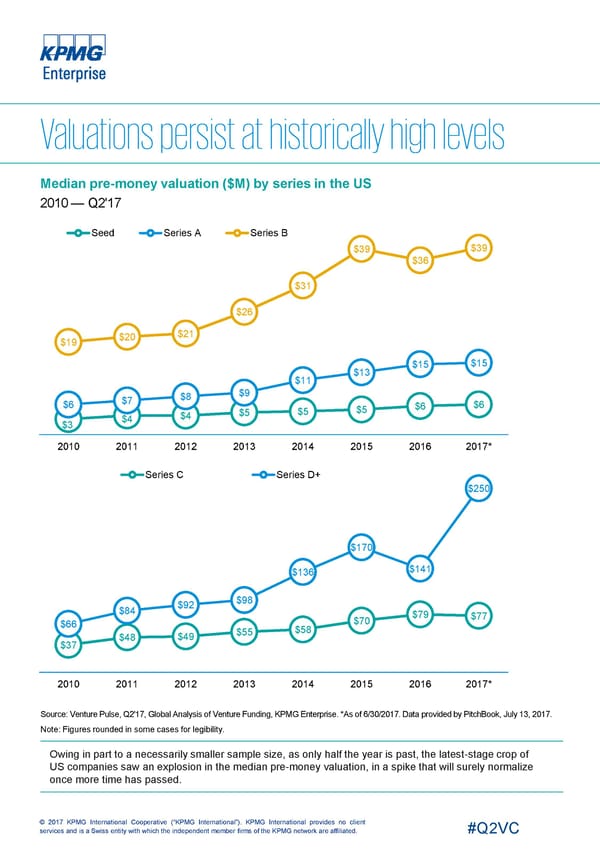
Median pre-money valuation ($M) by series in the US 2010 — Q2'17 Seed Series A Series B $39 $39 $36 $31 $26 $21 $20 $19 $15 $15 $13 $11 $9 $8 $7 $6 $6 $6 $5 $5 $5 $4 $4 $3 2010 2011 2012 2013 2014 2015 2016 2017* Series C Series D+ $250 $170 $141 $136 $98 $92 $84 $79 $77 $70 $66 $58 $55 $48 $49 $37 2010 2011 2012 2013 2014 2015 2016 2017* Source: Venture Pulse, Q2'17, Global Analysis of Venture Funding, KPMG Enterprise. *As of 6/30/2017. Data provided by PitchBook, July 13, 2017. Note: Figures rounded in some cases for legibility. Owing in part to a necessarily smaller sample size, as only half the year is past, the latest-stage crop of US companies saw an explosion in the median pre-money valuation, in a spike that will surely normalize once more time has passed. © 2017 KPMG International Cooperative (“KPMG International”). KPMG International provides no client services and is a Swiss entity with which the independent member firms of the KPMG network are affiliated. #Q2VC
 USA Page 7 Page 9