
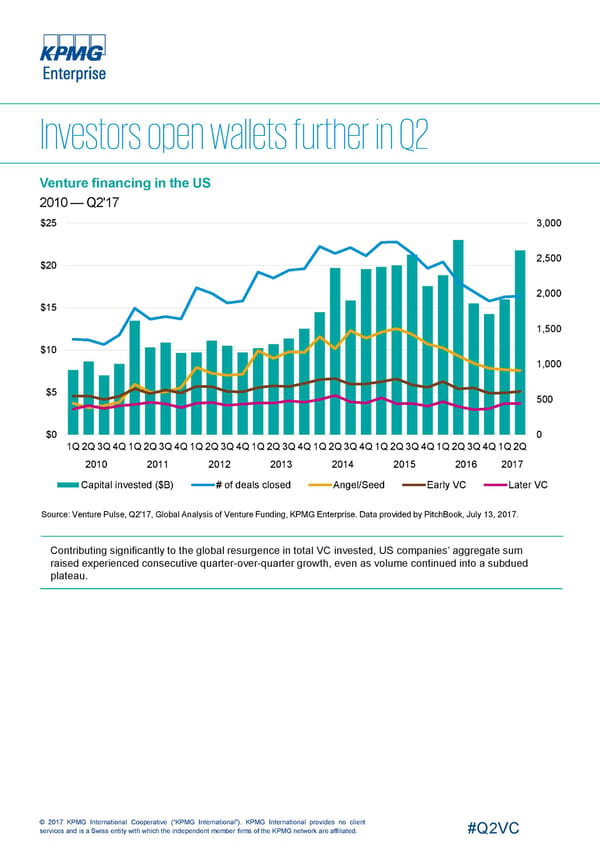
Venture financing in the US 2010 —Q2'17 $25 3,000 2,500 $20 2,000 $15 1,500 $10 1,000 $5 500 $0 0 1Q2Q3Q4Q1Q2Q3Q4Q1Q2Q3Q4Q1Q2Q3Q4Q1Q2Q3Q4Q1Q2Q3Q4Q1Q2Q3Q4Q1Q2Q 2010 2011 2012 2013 2014 2015 2016 2017 Capital invested ($B) # of deals closed Angel/Seed Early VC Later VC Source: Venture Pulse, Q2'17, Global Analysis of Venture Funding, KPMG Enterprise. Data provided by PitchBook, July 13, 2017. Contributing significantly to the global resurgence in total VC invested, US companies’ aggregate sum raised experienced consecutive quarter-over-quarter growth, even as volume continued into a subdued plateau. © 2017 KPMG International Cooperative (“KPMG International”). KPMG International provides no client services and is a Swiss entity with which the independent member firms of the KPMG network are affiliated. #Q2VC
 USA Page 4 Page 6