
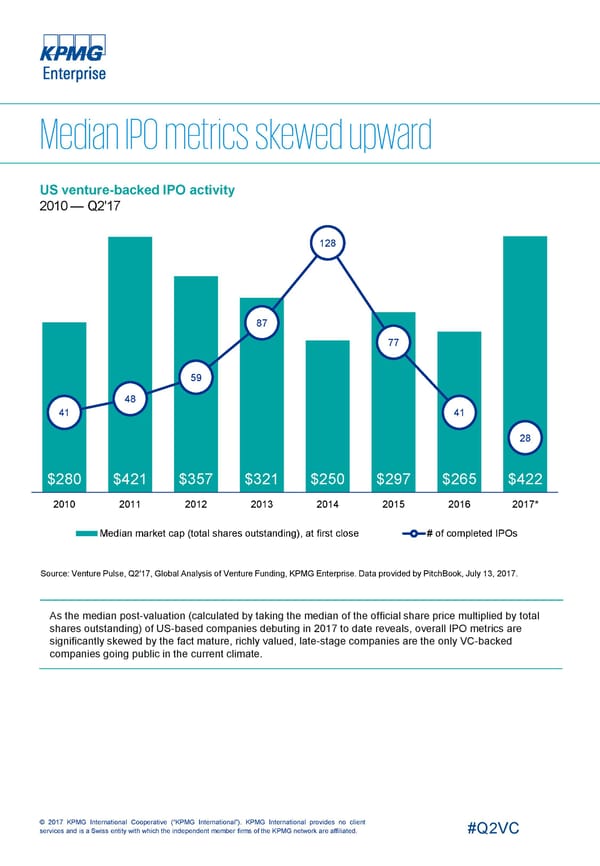
US venture-backed IPO activity 2010 — Q2'17 128 87 77 59 48 41 41 28 $280 $421 $357 $321 $250 $297 $265 $422 2010 2011 2012 2013 2014 2015 2016 2017* Median market cap (total shares outstanding), at first close # of completed IPOs Source: Venture Pulse, Q2'17, Global Analysis of Venture Funding, KPMG Enterprise. Data provided by PitchBook, July 13, 2017. As the median post-valuation (calculated by taking the median of the official share price multiplied by total shares outstanding) of US-based companies debuting in 2017 to date reveals, overall IPO metrics are significantly skewed by the fact mature, richly valued, late-stage companies are the only VC-backed companies going public in the current climate. © 2017 KPMG International Cooperative (“KPMG International”). KPMG International provides no client services and is a Swiss entity with which the independent member firms of the KPMG network are affiliated. #Q2VC
 USA Page 22 Page 24