
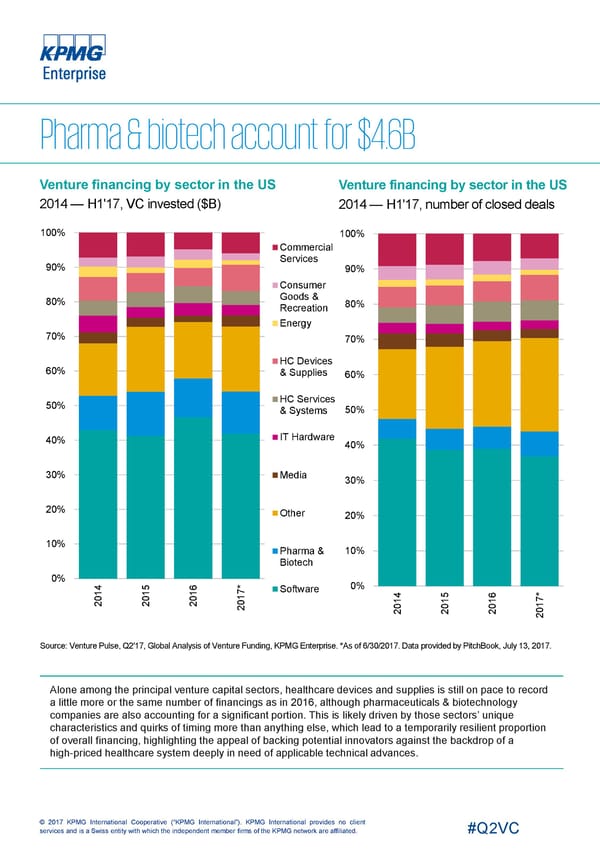
Venture financing by sector in the US Venture financing by sector in the US 2014 — H1'17, VC invested ($B) 2014 — H1'17, number of closed deals 100% 100% Commercial Services 90% 90% Consumer Goods & 80% 80% Recreation Energy 70% 70% HC Devices 60% & Supplies 60% HC Services 50% & Systems 50% IT Hardware 40% 40% 30% Media 30% 20% Other 20% 10% Pharma & 10% Biotech 0% 4 5 6 * 0% 7 Software 1 1 1 4 5 6 * 0 0 0 1 7 0 1 1 1 2 2 2 0 0 0 1 2 0 2 2 2 2 Source: Venture Pulse, Q2'17, Global Analysis of Venture Funding, KPMG Enterprise. *As of 6/30/2017. Data provided by PitchBook, July 13, 2017. Alone among the principal venture capital sectors, healthcare devices and supplies is still on pace to record a little more or the same number of financings as in 2016, although pharmaceuticals & biotechnology companies are also accounting for a significant portion. This is likely driven by those sectors’ unique characteristics and quirks of timing more than anything else, which lead to a temporarily resilient proportion of overall financing, highlighting the appeal of backing potential innovators against the backdrop of a high-priced healthcare system deeply in need of applicable technical advances. © 2017 KPMG International Cooperative (“KPMG International”). KPMG International provides no client services and is a Swiss entity with which the independent member firms of the KPMG network are affiliated. #Q2VC
 USA Page 9 Page 11