
Global
Global VC Investment Soars
Globally, in Q2'17 VC- backed companies raised across 2,985 deals
Two massive deals in China propelled global venture funding up significantly in Q2’17, although funding remained well off of the high reached in Q2’16. While VC investment rose, global deal activity continued to decline — hitting a nine-quarter low during the quarter. Angel and seed stage deal activity took the hardest hit, although the number of deals declined across all major deal stages. Mega-deals make big comeback globally After a quiet year, the number of mega-deals rose sharply during Q2’17, with the top 10 deals globally accounting for $10.83 billion in investment. China accounted for two $1 billion+ mega-deals, including a $5.5 billion funding round to ride hailing platform Didi Chuxing — the world’s largest tech funding round ever —and a $1 billion funding round to news aggregator Toutiao. mega-deals also made a roaring comeback in the US, with both Lyft and Outcome Health raising $600 million rounds, and numerous other companies holding $100 million+ rounds. Even Europe achieved a relatively strong showing on the mega-deals front, with $100 million+ funding rounds to Improbable, Auto1 Group and DeltaGamma Therapeutics. Return of the Unicorns After a period of low valuations and even a number of unicorn deaths, the pendulum shifted during Q2’17, with the number of unicorn births making a strong comeback. Sixteen new unicorns entered the mix during the quarter, the highest number seen since Q3’15. Among the new unicorns were Improbable in the United Kingdom, Otto Bock Healthcare in Germany, MoBike in China, Avoloq Group in Switzerland, and Outcome Health in the US. Delivery services come into the spotlight Globally, delivery options took center stage in several jurisdictions during Q2’17 — particularly in Europe, where Delivery Hero raised $421M in private equity funding, and in the US, where a major global online retailer acquired a global brick-and-mortar grocery chain. While both transactions revolved around food delivery, the real excitement for investors may be in the shift towards a much broader view of delivery opportunities, including a stronger focus on B2B services. Such B2B-focused transactions are likely to attract additional attention in the future, not just in the food industry, but in many others as well. Agritech and foodtech industries gaining steam While food delivery may be a key issue today, companies looking toward the future have begun to focus on other key aspects of the food and beverage sector, such as food security and sustainability. Currently, agritech and foodtech may be relatively small segments of VC investment globally, but they are expected to grow over time, given that food shortages are projected to become more prevalent over time. Historically, traditional VC investors have not found the industry particularly attractive, likely as a result of the funds required and the inability to envision strong exits. However, corporate investors are beginning to take notice of the potential offered by agritech and foodtech as they look to leverage innovative technologies in their own operations and supply chains. © 2017 KPMG International Cooperative (“KPMG International”). KPMG International provides no client services and is a Swiss entity with which the independent member firms of the KPMG network are affiliated. #Q2VC
Doors to IPO market swinging open After a year-long drought in the global IPO market, Q2’17 saw the IPO doors opening further following a tentative start in Q1’17. Already in 2017, five major unicorns have held IPOs, including Cloudera, China Rapid Finance and Okta during Q2. Others are expected to follow suit heading into Q3’17. While the number of IPOs are not expected to approach historical highs, the rebound, combined with strong M&A activity, is likely to lead to some renewal across the VC market as a whole and the release of some of the built up unrealized gains. Trends to watch for globally Globally, blockchain is expected to continue to attract investor interest and attention. While there will continue to be a focus on leveraging the technology in applications related to financial services, looking ahead, there will also likely be a shift toward investing in technologies that leverage blockchain for other industries (e.g. agriculture, retail) or operational verticals (e.g. analytics, performance management). AI, virtual reality and healthtech — including biotech — are also expected to be hot areas of investment throughout the remainder of 2017. © 2017 KPMG International Cooperative (“KPMG International”). KPMG International provides no client services and is a Swiss entity with which the independent member firms of the KPMG network are affiliated. #Q2VC
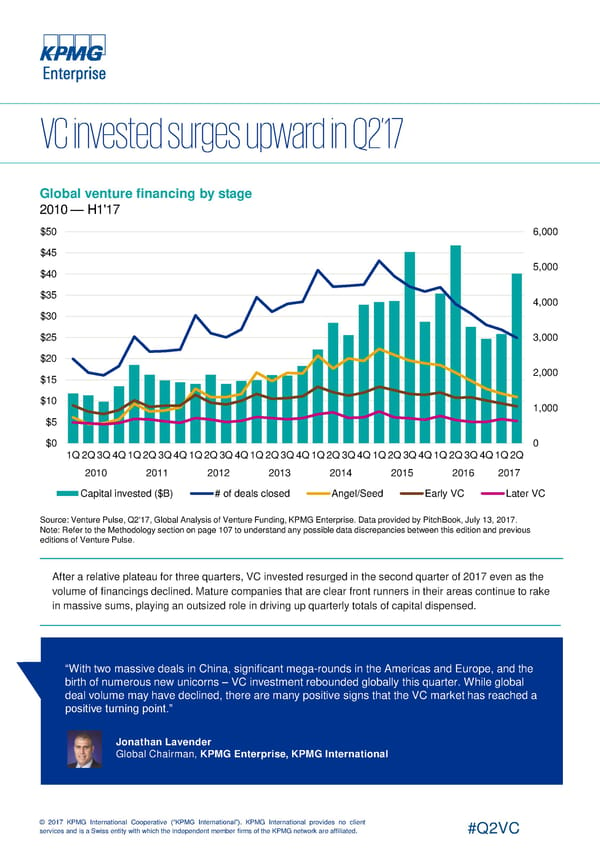
Global venture financing by stage 2010 — H1'17 $50 6,000 $45 $40 5,000 $35 4,000 $30 $25 3,000 $20 $15 2,000 $10 1,000 $5 $0 0 1Q2Q3Q4Q1Q2Q3Q4Q1Q2Q3Q4Q1Q2Q3Q4Q1Q2Q3Q4Q1Q2Q3Q4Q1Q2Q3Q4Q1Q2Q 2010 2011 2012 2013 2014 2015 2016 2017 Capital invested ($B) # of deals closed Angel/Seed Early VC Later VC Source: Venture Pulse, Q2'17, Global Analysis of Venture Funding, KPMG Enterprise. Data provided by PitchBook, July 13, 2017. Note: Refer to the Methodology section on page 107 to understand any possible data discrepancies between this edition and previous editions of Venture Pulse. After a relative plateau for three quarters, VC invested resurged in the second quarter of 2017 even as the volume of financings declined. Mature companies that are clear front runners in their areas continue to rake in massive sums, playing an outsized role in driving up quarterly totals of capital dispensed. “With two massive deals in China, significant mega-rounds in the Americas and Europe, and the birth of numerous new unicorns – VC investment rebounded globally this quarter. While global deal volume may have declined, there are many positive signs that the VC market has reached a positive turning point.” Jonathan Lavender Global Chairman, KPMG Enterprise, KPMG International © 2017 KPMG International Cooperative (“KPMG International”). KPMG International provides no client services and is a Swiss entity with which the independent member firms of the KPMG network are affiliated. #Q2VC
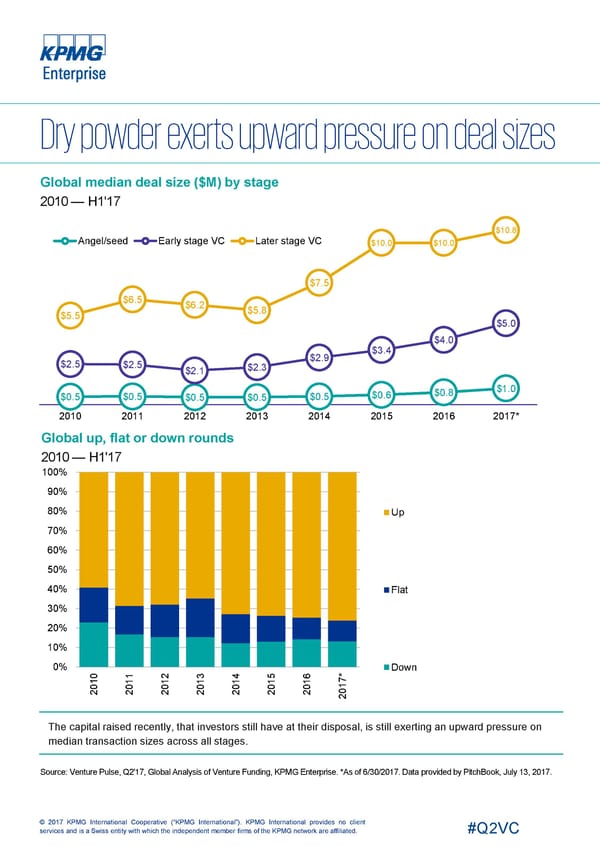
Global median deal size ($M) by stage 2010 — H1'17 $10.8 Angel/seed Early stage VC Later stage VC $10.0 $10.0 $7.5 $6.5 $6.2 $5.8 $5.5 $5.0 $4.0 $3.4 $2.9 $2.5 $2.5 $2.3 $2.1 $1.0 $0.8 $0.6 $0.5 $0.5 $0.5 $0.5 $0.5 2010 2011 2012 2013 2014 2015 2016 2017* Global up, flat or down rounds 2010 — H1'17 100% 90% 80% Up 70% 60% 50% 40% Flat 30% 20% 10% 0% Down 1 2 3 4 5 6 * 10 1 1 1 1 1 1 7 0 0 0 0 0 0 1 20 2 2 2 2 2 2 0 2 The capital raised recently, that investors still have at their disposal, is still exerting an upward pressure on median transaction sizes across all stages. Source: Venture Pulse, Q2'17, Global Analysis of Venture Funding, KPMG Enterprise. *As of 6/30/2017. Data provided by PitchBook,July 13, 2017. © 2017 KPMG International Cooperative (“KPMG International”). KPMG International provides no client services and is a Swiss entity with which the independent member firms of the KPMG network are affiliated. #Q2VC
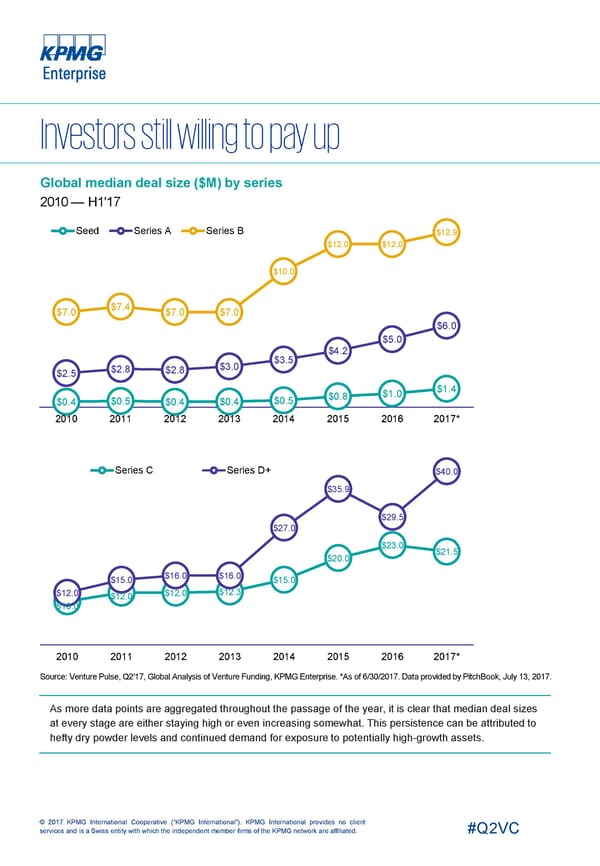
Global median deal size ($M) by series 2010 — H1'17 Seed Series A Series B $12.9 $12.0 $12.0 $10.0 $7.4 $7.0 $7.0 $7.0 $6.0 $5.0 $4.2 $3.5 $3.0 $2.8 $2.8 $2.5 $1.4 $1.0 $0.8 $0.5 $0.5 $0.4 $0.4 $0.4 2010 2011 2012 2013 2014 2015 2016 2017* Series C Series D+ $40.0 $35.9 $29.5 $27.0 $23.0 $21.5 $20.0 $16.0 $16.0 $15.0 $15.0 $12.3 $12.0 $12.0 $12.0 $10.0 2010 2011 2012 2013 2014 2015 2016 2017* Source: Venture Pulse, Q2'17, Global Analysis of Venture Funding, KPMG Enterprise. *As of 6/30/2017. Data provided by PitchBook,July 13, 2017. As more data points are aggregated throughout the passage of the year, it is clear that median deal sizes at every stage are either staying high or even increasing somewhat. This persistence can be attributed to hefty dry powder levels and continued demand for exposure to potentially high-growth assets. © 2017 KPMG International Cooperative (“KPMG International”). KPMG International provides no client services and is a Swiss entity with which the independent member firms of the KPMG network are affiliated. #Q2VC
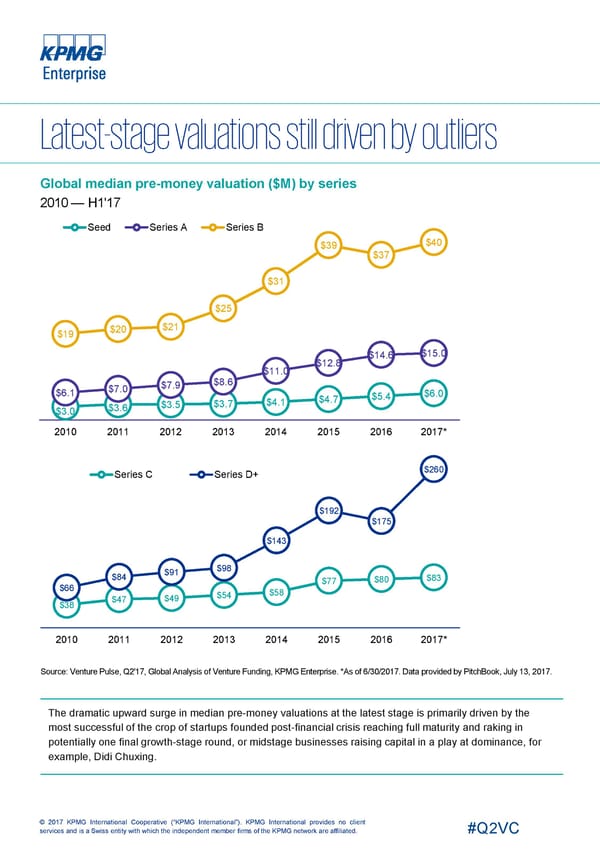
Global median pre-money valuation ($M) by series 2010 — H1'17 Seed Series A Series B $40 $39 $37 $31 $25 $21 $20 $19 $15.0 $14.6 $12.8 $11.0 $8.6 $7.9 $7.0 $6.1 $6.0 $5.4 $4.7 $4.1 $3.5 $3.7 $3.6 $3.0 2010 2011 2012 2013 2014 2015 2016 2017* $260 Series C Series D+ $192 $175 $143 $98 $91 $84 $83 $80 $77 $66 $58 $54 $49 $47 $38 2010 2011 2012 2013 2014 2015 2016 2017* Source: Venture Pulse, Q2'17, Global Analysis of Venture Funding, KPMG Enterprise. *As of 6/30/2017. Data provided by PitchBook, July 13, 2017. The dramatic upward surge in median pre-money valuations at the latest stage is primarily driven by the most successful of the crop of startups founded post-financial crisis reaching full maturity and raking in potentially one final growth-stage round, or midstage businesses raising capital in a play at dominance, for example, Didi Chuxing. © 2017 KPMG International Cooperative (“KPMG International”). KPMG International provides no client services and is a Swiss entity with which the independent member firms of the KPMG network are affiliated. #Q2VC
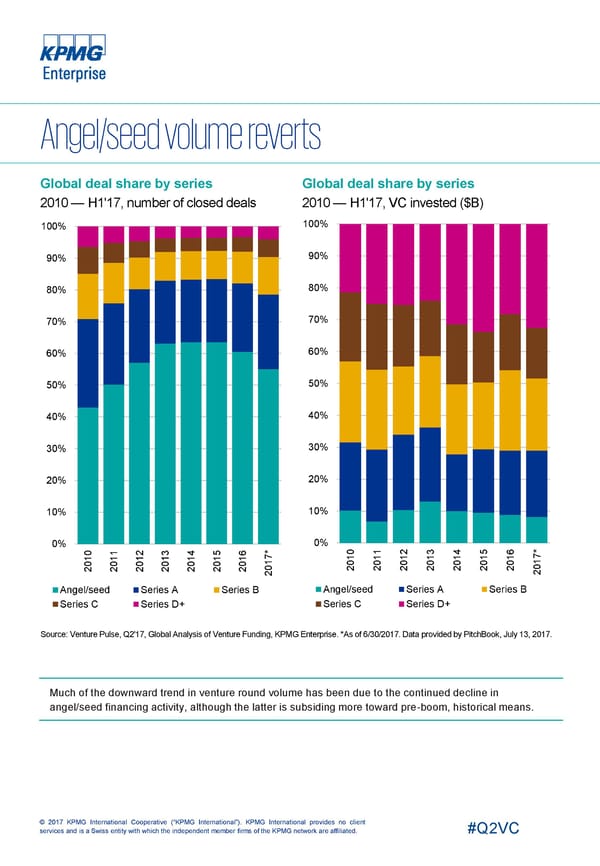
Global deal share by series Global deal share by series 2010 — H1'17, number of closed deals 2010 — H1'17, VC invested ($B) 100% 100% 90% 90% 80% 80% 70% 70% 60% 60% 50% 50% 40% 40% 30% 30% 20% 20% 10% 10% 0% 0% * 0 1 2 3 4 5 6 * 0 1 4 5 6 7 1 1 1 1 1 1 1 7 1 1 12 13 1 1 1 1 0 0 0 0 0 0 0 1 0 0 0 0 0 0 2 2 2 2 2 2 2 0 2 2 20 20 2 2 2 2 2 Angel/seed Series A Series B Angel/seed Series A Series B Series C Series D+ Series C Series D+ Source: Venture Pulse, Q2'17, Global Analysis of Venture Funding, KPMG Enterprise. *As of 6/30/2017. Data provided by PitchBook, July 13, 2017. Much of the downward trend in venture round volume has been due to the continued decline in angel/seed financing activity, although the latter is subsiding more toward pre-boom, historical means. © 2017 KPMG International Cooperative (“KPMG International”). KPMG International provides no client services and is a Swiss entity with which the independent member firms of the KPMG network are affiliated. #Q2VC
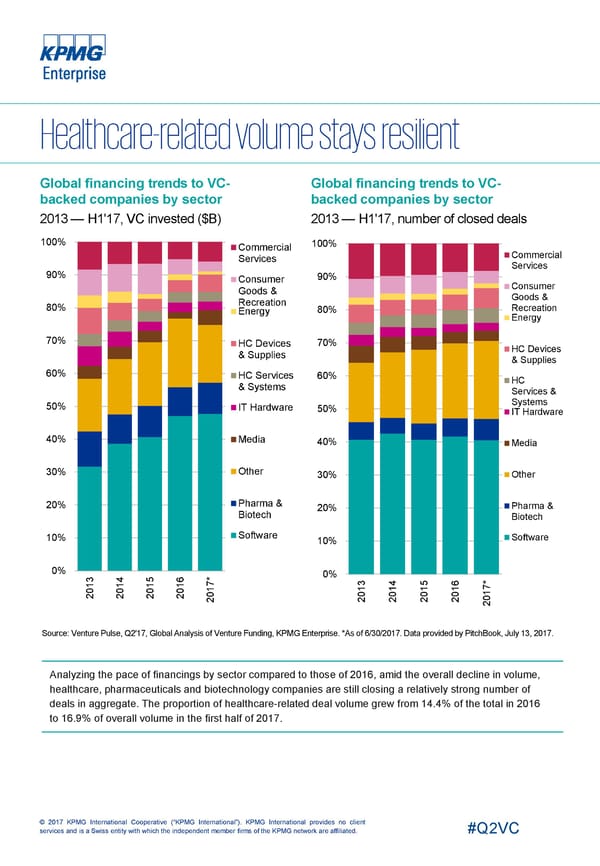
Global financing trends to VC- Global financing trends to VC- backedcompanies by sector backedcompanies by sector 2013 — H1'17, VC invested ($B) 2013 — H1'17, number of closed deals 100% 100% Commercial Commercial Services Services 90% 90% Consumer Consumer Goods & Goods & Recreation 80% Recreation 80% Energy Energy 70% HC Devices 70% HC Devices & Supplies & Supplies 60% HC Services 60% HC & Systems Services & Systems 50% IT Hardware 50% IT Hardware 40% Media 40% Media 30% Other 30% Other Pharma & 20% Pharma & 20% Biotech Biotech Software 10% Software 10% 0% 0% 3 4 5 6 * 7 3 5 6 * 1 1 1 1 7 0 0 0 0 1 1 14 1 1 0 0 0 0 1 2 2 2 2 0 2 2 20 2 2 2 Source: Venture Pulse, Q2'17, Global Analysis of Venture Funding, KPMG Enterprise. *As of 6/30/2017. Data provided by PitchBook, July 13, 2017. Analyzing the pace of financings by sector compared to those of 2016, amid the overall decline in volume, healthcare, pharmaceuticals and biotechnology companies are still closing a relatively strong number of deals in aggregate. The proportion of healthcare-related deal volume grew from 14.4% of the total in 2016 to 16.9% of overall volume in the first half of 2017. © 2017 KPMG International Cooperative (“KPMG International”). KPMG International provides no client services and is a Swiss entity with which the independent member firms of the KPMG network are affiliated. #Q2VC
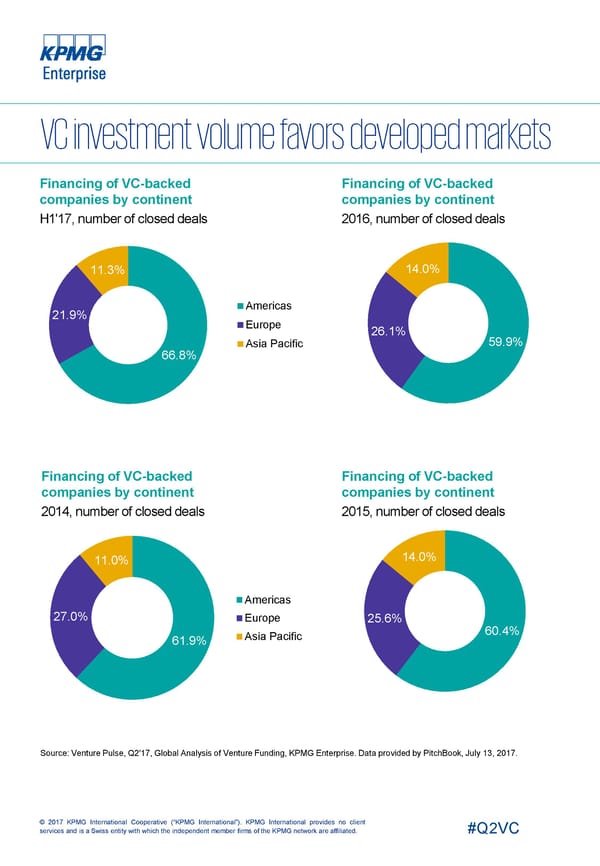
Financing of VC-backed Financing of VC-backed companies by continent companies by continent H1'17, number of closed deals 2016, number of closed deals 11.3% 14.0% Americas 21.9% Europe 26.1% 59.9% Asia Pacific 66.8% Financing of VC-backed Financing of VC-backed companies by continent companies by continent 2014, number of closed deals 2015, number of closed deals 14.0% 11.0% Americas 27.0% Europe 25.6% 60.4% Asia Pacific 61.9% Source: Venture Pulse, Q2'17, Global Analysis of Venture Funding, KPMG Enterprise. Data provided by PitchBook, July 13, 2017. © 2017 KPMG International Cooperative (“KPMG International”). KPMG International provides no client services and is a Swiss entity with which the independent member firms of the KPMG network are affiliated. #Q2VC
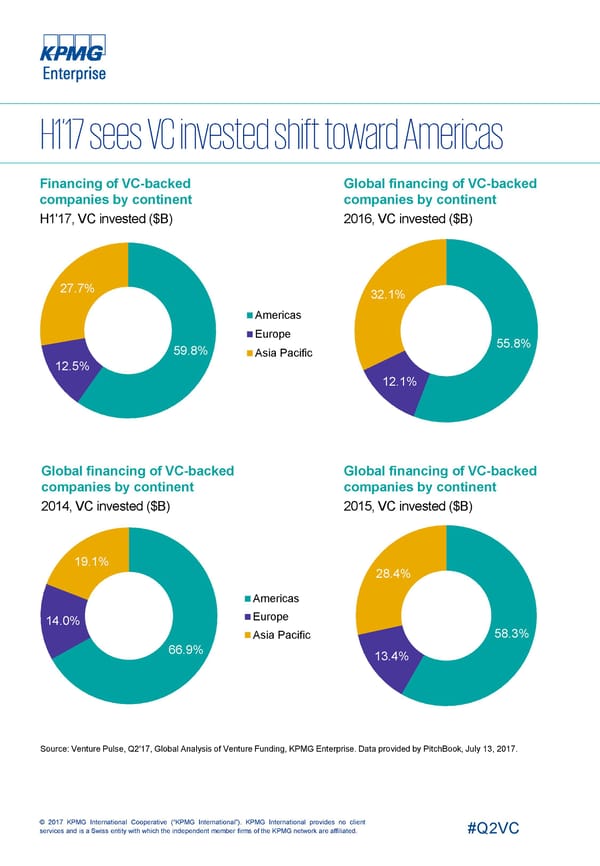
Financing of VC-backed Global financing of VC-backed companies by continent companies by continent H1'17, VC invested ($B) 2016, VC invested ($B) 27.7% 32.1% Americas Europe 55.8% 59.8% Asia Pacific 12.5% 12.1% Global financing of VC-backed Global financing of VC-backed companies by continent companies by continent 2014, VC invested ($B) 2015, VC invested ($B) 19.1% 28.4% Americas Europe 14.0% Asia Pacific 58.3% 66.9% 13.4% Source: Venture Pulse, Q2'17, Global Analysis of Venture Funding, KPMG Enterprise. Data provided by PitchBook, July 13, 2017. © 2017 KPMG International Cooperative (“KPMG International”). KPMG International provides no client services and is a Swiss entity with which the independent member firms of the KPMG network are affiliated. #Q2VC
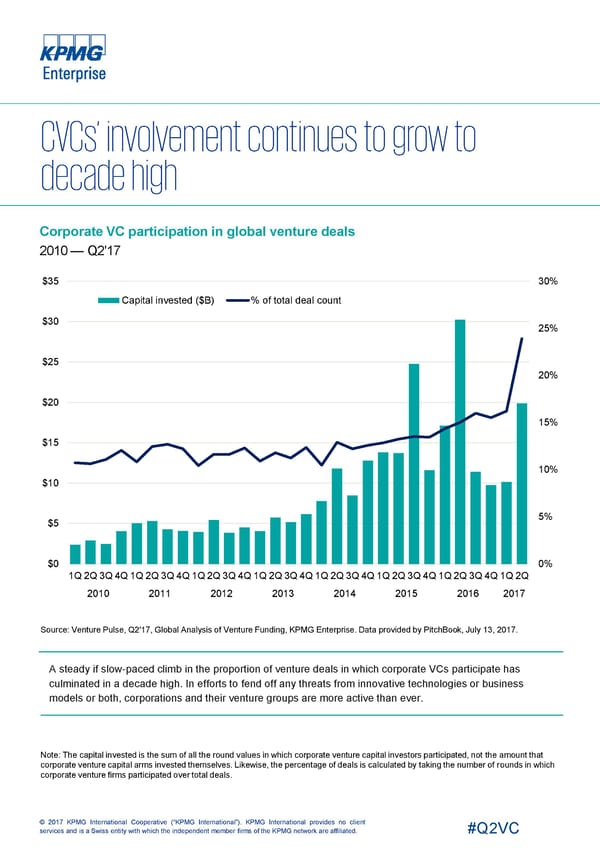
Corporate VC participation in global venture deals 2010 — Q2'17 $35 30% Capital invested ($B) % of total deal count $30 25% $25 20% $20 15% $15 10% $10 5% $5 $0 0% 1Q2Q3Q4Q1Q2Q3Q4Q1Q2Q3Q4Q1Q2Q3Q4Q1Q2Q3Q4Q1Q2Q3Q4Q1Q2Q3Q4Q1Q2Q 2010 2011 2012 2013 2014 2015 2016 2017 Source: Venture Pulse, Q2'17, Global Analysis of Venture Funding, KPMG Enterprise. Data provided by PitchBook, July 13, 2017. A steady if slow-paced climb in the proportion of venture deals in which corporate VCs participate has culminated in a decade high. In efforts to fend off any threats from innovative technologies or business models or both, corporations and their venture groups are more active than ever. Note: The capital invested is the sum of all the round values in which corporate venture capital investors participated, not the amount that corporate venture capital arms invested themselves. Likewise, the percentage of deals is calculated by taking the number of rounds in which corporate venture firms participated over total deals. © 2017 KPMG International Cooperative (“KPMG International”). KPMG International provides no client services and is a Swiss entity with which the independent member firms of the KPMG network are affiliated. #Q2VC
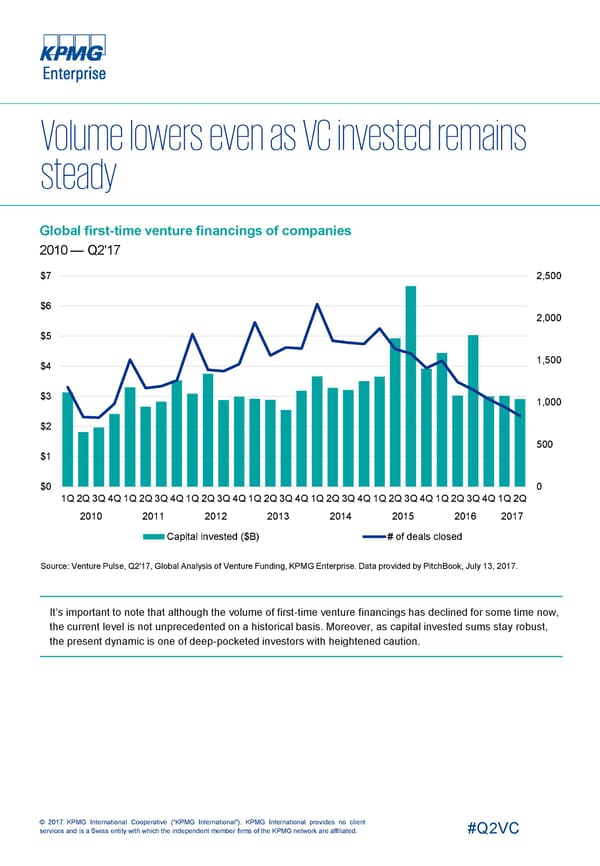
Global first-time venture financings of companies 2010 — Q2'17 $7 2,500 $6 2,000 $5 1,500 $4 $3 1,000 $2 500 $1 $0 0 1Q2Q3Q4Q1Q2Q3Q4Q1Q2Q3Q4Q1Q2Q3Q4Q1Q2Q3Q4Q1Q2Q3Q4Q1Q2Q3Q4Q1Q2Q 2010 2011 2012 2013 2014 2015 2016 2017 Capital invested ($B) # of deals closed Source: Venture Pulse, Q2'17, Global Analysis of Venture Funding, KPMG Enterprise. Data provided by PitchBook, July 13, 2017. It’s important to note that although the volume of first-time venture financings has declined for some time now, the current level is not unprecedented on a historical basis. Moreover, as capital invested sums stay robust, the present dynamic is one of deep-pocketed investors with heightened caution. © 2017 KPMG International Cooperative (“KPMG International”). KPMG International provides no client services and is a Swiss entity with which the independent member firms of the KPMG network are affiliated. #Q2VC
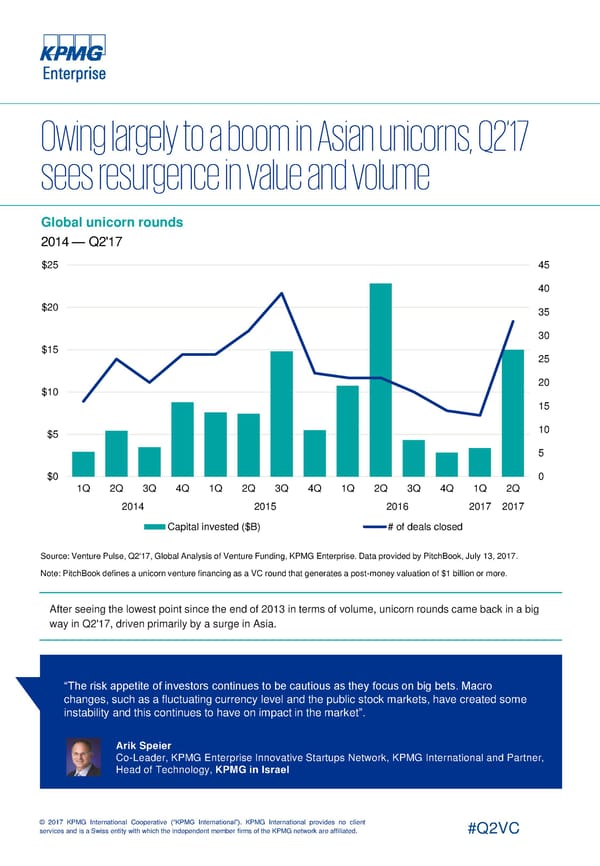
Global unicorn rounds 2014 — Q2'17 $25 45 40 $20 35 30 $15 25 $10 20 15 $5 10 5 $0 0 1Q 2Q 3Q 4Q 1Q 2Q 3Q 4Q 1Q 2Q 3Q 4Q 1Q 2Q 2014 2015 2016 2017 2017 Capital invested ($B) # of deals closed Source: Venture Pulse, Q2'17, Global Analysis of Venture Funding, KPMG Enterprise. Data provided by PitchBook, July 13, 2017. Note: PitchBook defines a unicorn venture financing as a VC round that generates a post-money valuation of $1 billion or more. After seeing the lowest point since the end of 2013 in terms of volume, unicorn rounds came back in a big way in Q2'17, driven primarily by a surge in Asia. “The risk appetite of investors continues to be cautious as they focus on big bets. Macro changes, such as a fluctuating currency level and the public stock markets, have created some instability and this continues to have on impact in the market”. Arik Speier Co-Leader, KPMG Enterprise Innovative Startups Network, KPMG International and Partner, Head of Technology, KPMG in Israel © 2017 KPMG International Cooperative (“KPMG International”). KPMG International provides no client services and is a Swiss entity with which the independent member firms of the KPMG network are affiliated. #Q2VC
Biotechnology continues to show strong and steady investment worldwide. Broadly defined, biotech uses technology to harness or influence natural biological processes and organisms, with applications that span health and medicinal, agroscience and genetic engineering. The first two quarters of 2017 saw a $3.87B of VC investment in biotech across 259 deals worldwide. This is on track to maintain pace with 2016’s $6.63B across 504 deals. Therapeutics a hot subsector poised for growth Biotech therapeutics, which is focused on the creation of novel compounds and molecules for the development of new medicines, is a particularly strong area. Current activity shows strong growth and the potential for greater capital deployment in hot therapeutics subsectors including diagnostics, neuroscience, and advanced therapies. Oncology remains a dominant area of this subsector, while the central nervous system is a strong and growing area, especially as firms look for treatments for ailments such as Alzheimer’s disease in an aging population. Antibiotics, antibodies, and anti-infectives continue to gain attention. Funding challenges lead to early exits Despite rising interest in the biotech sector, many biotech startups struggle to raise sufficient funding, especially in the early-stages. Much of this challenge stems from the inherent nature of biotech rather than lack of potential. In contrast to sectors such as information technology (IT), development lead times are long, sometimes in excess of fifteen years, while the chances of achieving a marketable product is often estimated at five percent or less. As a result, to satisfy investors seeking measurable results, many biotech companies look to early IPOs not as a true exit, but rather as a way to fuel ongoing growth. US remains dominant in global biotech activity In terms of both the number of companies and total investment dollars, the US dominates the global biotechnology sector. Local biotech startup activity is especially driven by broader life sciences activity in Boston, Los Angeles, San Diego, and the San Francisco Bay Area, with additional activity clusters gathered around leading universities across the country. US biotechs’ competitive advantage stems from three areas: the risk-taking attitude of local VCs, the high per capita healthcare spend in the US, and the economy of scale that the US market offers for the marketing and sale of biopharmaceutical products. Biotech activity in Europe remains strong, but lacks the critical mass seen in the US due to the spread of life sciences clusters across the continent. European market access also remains fragmented, despite ongoing EU efforts. The strongest activity levels are currently seen in the UK and Switzerland, where the large number of biopharmaceutical groups create a rich environment for life sciences. However, restrictions on immigration following Brexit could adversely impact the growth of the UK biopharmaceutical industry in the future. The competitive cost for researchers is also spurring biotech activity in areas such as Paris, Munich and Berlin, as well as the Nordics, northern Italy, Ireland and Spain. Due to the small size and number of European investors focused on biotech and life sciences, many European biotech startups turn to the US to seek funding opportunities. © 2017 KPMG International Cooperative (“KPMG International”). KPMG International provides no client services and is a Swiss entity with which the independent member firms of the KPMG network are affiliated. #Q2VC
China’s biotech sector on the rise The biotech industry in China has shown exciting growth over the past few years. While traditionally Chinese companies focused on generics, including bio-generics for the domestic market or the manufacturing of active pharmaceutical ingredients (APIs) for domestic and global Pharmas, a considerable recent increase in biopharmaceutical companies with global ambitions can be observed. These companies are active in a large array of fields ranging from biosimilars to cancer treatments or gene therapies and they have the ambition to succeed on the global market place In June, China's Nanjing Legend Biotech Co. made worldwide headlines when it announced that its novel cell and gene therapy had induced remission in patients with multiple myeloma, a blood plasma cancer. The same month, Chinese company WuXi Biologics, a contract drug research and development company, completed Hong Kong’s largest IPO of the year, raising $511 million.¹ Foreign companies have taken note of this growth. Nearly all of the big pharmaceutical companies have established substantial research centers in China, attracted by the availability of skilled talent and the opportunity to collaborate with Chinese researchers. However, the new Chinese Data Protection Act, which limits the transferral of large amounts of data out of the country without government approval, could have a negative impact on future R&D activities of foreign owned companies in China.² Increasing interest from ICT (information and communication technology) investors In recent years, investors from the booming ICT fields have turned their attention toward life sciences. This is a strong sign that IT investors understand the potential inherent in the confluence of the digital and biological worlds. For example, in 2016 a stingray-like biological robot (cyborg) constructed out of heart cells, controlled by light and able to navigate a simple maze made headlines in 2016, drawing attention to the vast potential inherent in combined IT and life sciences ventures. The corporate VC arms of IT giants like Apple, Microsoft, and Google’s parent company Alphabet are all expanding into biotechnology. For example, Alphabet’s Verily Life Sciences LLC is joining a joint $300 million venture with pharma giant Novartis and the European Investment Fund to finance a biotech fund run by life sciences investment firm Medicxi.³ The joining of biotechnology and digitization is another important development. One such example is enhanced biologics firm Cellworks whose work in cancer research no longer needs a wet lab. Instead, it uses predictive computational sciences to calculate how new drugs can be used in combination to achieve the best results for patients. Other applications of Big Data and cognitive technologies to the life sciences, especially the development of new drugs, are poised to become more significant in the future. “The convergence of biologics and digitization has the potential to be a major game-changer, especially with the application of Big Data technology. With technology driving not only the development but also the use of new drugs and therapies on the patient end, it opens the door for more individualized medicine — designing drugs not just for a group of patients, but for each individual based on specific needs and traits.” Andre Guedel Head of Business Development, KPMG in Switzerland ¹http://www.reuters.com/article/wuxi-biologics-ipo-idUSL3N1J31JX ²http://www.reuters.com/article/us-health-cancer-cartcells-idUSKBN18W1GZ ³https://www.reuters.com/article/us-biotech-google-idUSKBN1953A2 © 2017 KPMG International Cooperative (“KPMG International”). KPMG International provides no client services and is a Swiss entity with which the independent member firms of the KPMG network are affiliated. #Q2VC
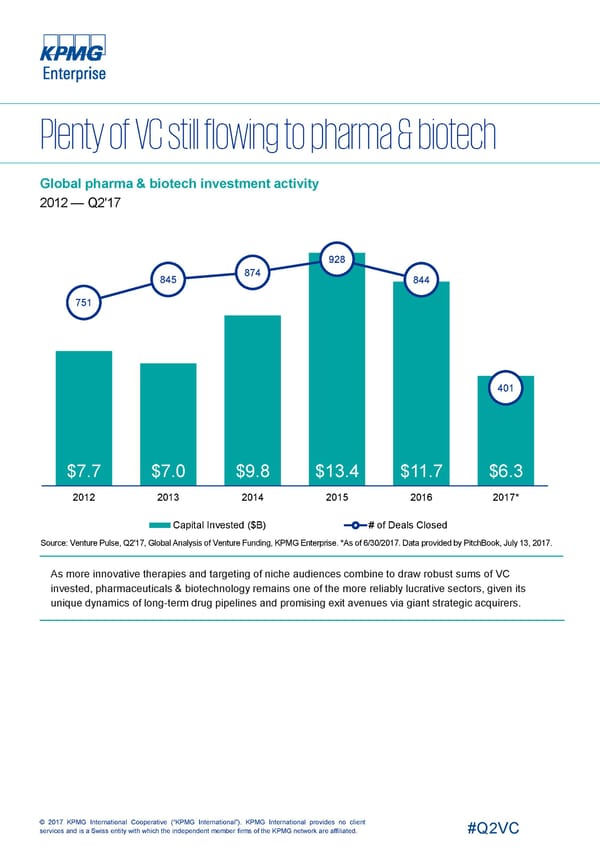
Global pharma & biotech investment activity 2012 — Q2'17 928 874 845 844 751 401 $7.7 $7.0 $9.8 $13.4 $11.7 $6.3 2012 2013 2014 2015 2016 2017* Capital Invested ($B) # of Deals Closed Source: Venture Pulse, Q2'17, Global Analysis of Venture Funding, KPMG Enterprise. *As of 6/30/2017. Data provided by PitchBook,July 13, 2017. As more innovative therapies and targeting of niche audiences combine to draw robust sums of VC invested, pharmaceuticals & biotechnology remains one of the more reliably lucrative sectors, given its unique dynamics of long-term drug pipelines and promising exit avenues via giant strategic acquirers. © 2017 KPMG International Cooperative (“KPMG International”). KPMG International provides no client services and is a Swiss entity with which the independent member firms of the KPMG network are affiliated. #Q2VC
The automotive industry is ripe for disruption, and autotech looks to be the lever that will move this world. Autotech is a broad category that spans not only new technologies designed for use in vehicles, but also the range of technologies that support radical changes to automotive insurance, auto sales, vehicle security, crash avoidance, and more. In 2013, the nascent autotech category pulled in only $6.5 million of venture capital investment. But following numerous eye-popping deals in the space made by large technology players and traditional automakers, VC funding has begun to pour in. With this investment comes the broad recognition that personal transportation is on the verge of momentous change. In the first 6 months of 2017, the amount of venture capital invested in the autotech sector soared to $254.1 million, on track to exceed the $517.6 million recorded for all of 2016. At 22, the number of deals in the first half of this year is set to exceed the 27 recorded in all of 2016. Despite the surge in growth already witnessed, experts agree that this is only the birth of a massive, multi-trillion dollar industry. The opportunity of autonomous vehicles When it comes to automotive technology, most people immediately think of autonomous cars, understandably. Self-driving vehicles have grabbed both headlines and VC investors’ imaginations. Tesla’s autopilot mode, Google’s Waymo, Apple’s Project Titan and Uber’s self-driving vehicles have all found a place in the public eye, but these are far from the only companies pursuing this massive opportunity. There is a healthy startup community, with names like Zoox, Cruise Automation and more drawing investment and acquisitions. Many also expect that Amazon may soon move into this space. California has quickly become the epicenter of self-driving car development and testing, with all major automakers establishing a presence in the region. In fact, California has issued licences to 33 companies to allow them to test autonomous vehicles on public roads, including tech giants, major automakers and international startups. Traditional suppliers in the auto industry, such as Bosch and Delphi, are also looking for a piece of the pie, with their corporate VC arms investing in autotech and related areas. Setting sights on innovative camera and sensor technologies While self-driving cars have taken the early spotlight, greater innovations can be seen in the range of exciting new technologies required for an autonomous vehicle to operate. One critical area is sensor technologies, used by vehicles to navigate safely. One major firm in this area is Israel’s Mobileye, which agreed to be acquired in Q2’17 by Intel Corp for $15.3 billion. Based on an idea originally stemming from military defense, Mobileye uses vision technology to create driver assistance and crash avoidance software. Intel’s massive bet is premised on the company’s forecast that the market for vehicle systems and data services for autonomous driving will be worth $70 billion by 2030. Other sensing technologies making waves include ultrasonic sensors, which use sound waves to identify nearby obstacles and LIDAR, which uses lasers to measure distances and create a 3D map of surrounding objects. © 2017 KPMG International Cooperative (“KPMG International”). KPMG International provides no client services and is a Swiss entity with which the independent member firms of the KPMG network are affiliated. #Q2VC
Smart cars driving investment into AI and deep learning The automotive industry is also driving considerable development of AI and deep learning technologies. These are the complex systems that must make sense of the varied sensor data input in real time to navigate safely, avoid accidents and reduce risk. This is a massive area that is attracting significant VC investment and attention, especially given that the possible applications of these technologies reach far beyond smart vehicles. In 2016, General Motors made headlines with their $1 billion acquisition of San Francisco-based Cruise Automation, while in Q1’17, Ford announced an investment of $1 billion over 5 years in new startup Argo AI. In Q2’17, California-based Drive.ai, which specializes in deep learning software for 4 driverless vehicles, secured $50 million in Series B funding led by NEA . Personal mobility poised for further disruption Another massive technology-driven change is how the consumer thinks about personal transportation. Already, ridesharing apps like Uber Didi Chuxing and Lyft have caused massive disruption to the taxi industry, while the growing car-sharing and on-demand vehicle market has made many urban consumers question whether they need a car at all. Continued investments in these spaces are expected globally, especially in developing markets. Green vehicle technologies, including electric cars and other environmentally friendly options, have also continued to garner attention as governments, companies and consumers alike look to reduce their carbon footprint. China’s green vehicle company Nio (formerly NextEV) is proving to be a disruptive leader in this space, securing $600 million in March from Baidu and launching its first 5 production model at the Shanghai auto show this year . Autotech trends on the horizon Despite the investment activity already seen, autotech is a new sector whose impact has yet to be fully felt. In coming years, look for new technologies and innovations to create massive change and disruption across every aspect of the auto industry, from manufacturing and sales, to insurance, driver experience, and on-road safety. 4 https://techcrunch.com/2017/06/27/drive-ai-raises-50m-for-retrofit-kits-to-bring-self-driving-to-existing-fleets/ 5 http://www.thisisinsider.com/china-driverless-car-market-funding-2017-6 © 2017 KPMG International Cooperative (“KPMG International”). KPMG International provides no client services and is a Swiss entity with which the independent member firms of the KPMG network are affiliated. #Q2VC
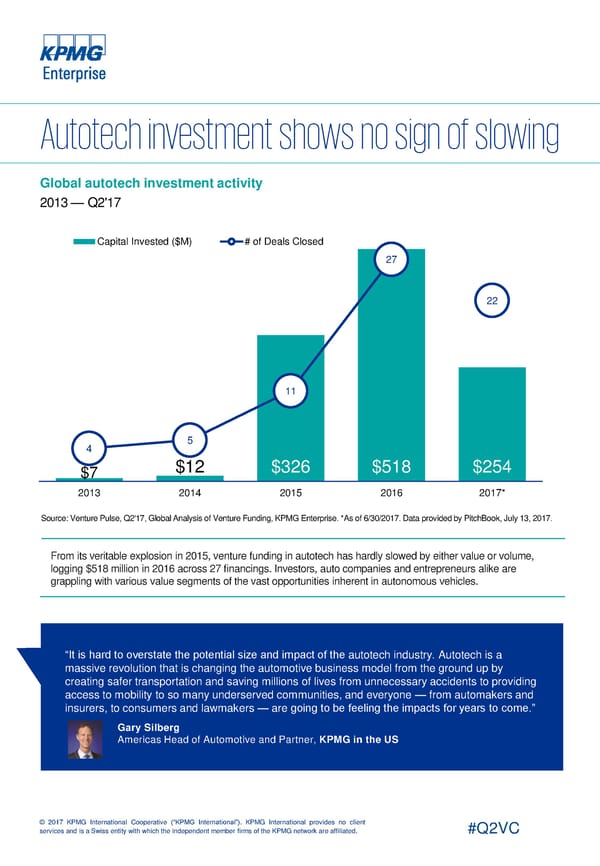
Global autotech investment activity 2013 — Q2'17 Capital Invested ($M) # of Deals Closed 27 22 11 4 5 $7 $12 $326 $518 $254 2013 2014 2015 2016 2017* Source: Venture Pulse, Q2'17, Global Analysis of Venture Funding, KPMG Enterprise. *As of 6/30/2017. Data provided by PitchBook,July 13, 2017. From its veritable explosion in 2015, venture funding in autotech has hardly slowed by either value or volume, logging $518 million in 2016 across 27 financings. Investors, auto companies and entrepreneurs alike are grappling with various value segments of the vast opportunities inherent in autonomous vehicles. “It is hard to overstate the potential size and impact of the autotech industry. Autotech is a massive revolution that is changing the automotive business model from the ground up by creating safer transportation and saving millions of lives from unnecessary accidents to providing access to mobility to so many underserved communities, and everyone — from automakers and insurers, to consumers and lawmakers — are going to be feeling the impacts for years to come.” Gary Silberg Americas Head of Automotive and Partner, KPMG in the US © 2017 KPMG International Cooperative (“KPMG International”). KPMG International provides no client services and is a Swiss entity with which the independent member firms of the KPMG network are affiliated. #Q2VC
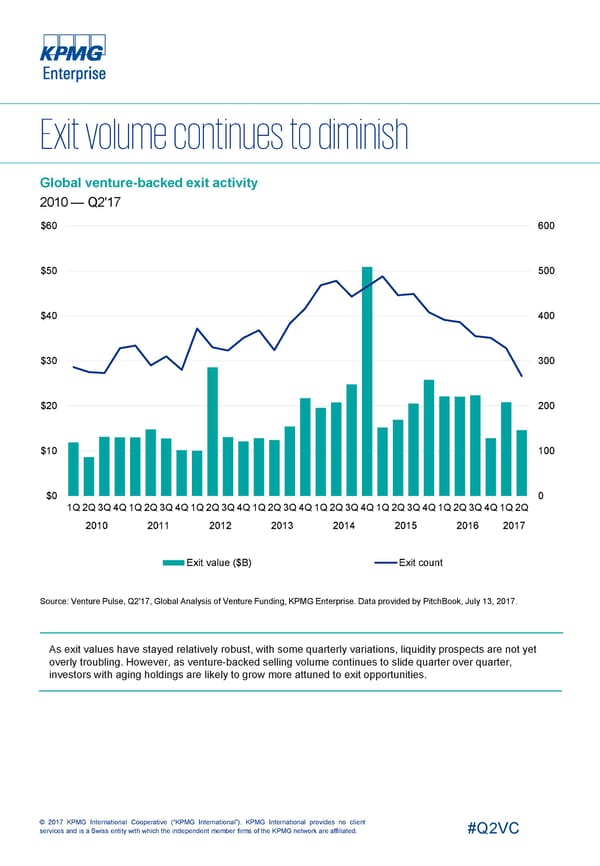
Global venture-backed exit activity 2010 — Q2'17 $60 600 $50 500 $40 400 $30 300 $20 200 $10 100 $0 0 1Q2Q3Q4Q1Q2Q3Q4Q1Q2Q3Q4Q1Q2Q3Q4Q1Q2Q3Q4Q1Q2Q3Q4Q1Q2Q3Q4Q1Q2Q 2010 2011 2012 2013 2014 2015 2016 2017 Exit value ($B) Exit count Source: Venture Pulse, Q2'17, Global Analysis of Venture Funding, KPMG Enterprise. Data provided by PitchBook, July 13, 2017. As exit values have stayed relatively robust, with some quarterly variations, liquidity prospects are not yet overly troubling. However, as venture-backed selling volume continues to slide quarter over quarter, investors with aging holdings are likely to grow more attuned to exit opportunities. © 2017 KPMG International Cooperative (“KPMG International”). KPMG International provides no client services and is a Swiss entity with which the independent member firms of the KPMG network are affiliated. #Q2VC
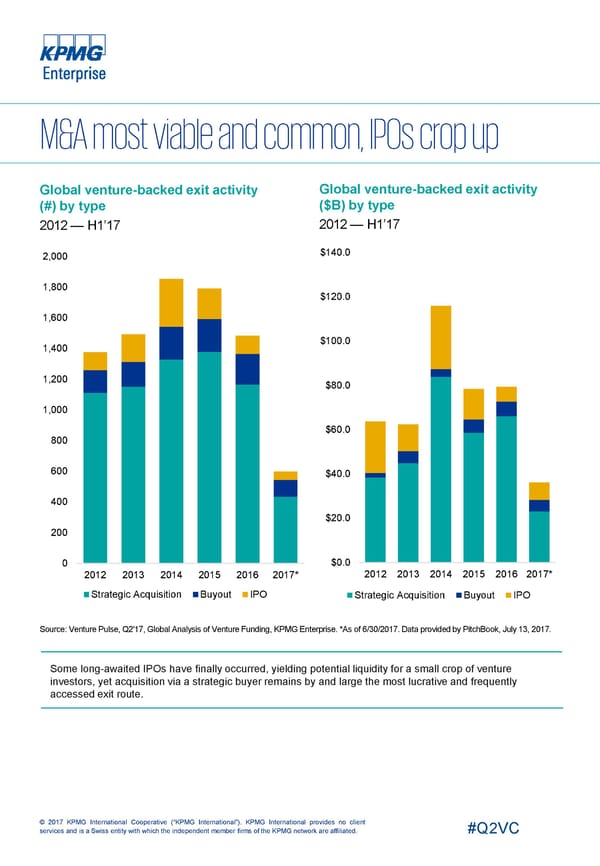
Global venture-backed exit activity Global venture-backed exit activity (#) by type ($B) by type 2012 — H1’17 2012 — H1’17 $140.0 2,000 1,800 $120.0 1,600 $100.0 1,400 1,200 $80.0 1,000 $60.0 800 600 $40.0 400 $20.0 200 0 $0.0 2012 2013 2014 2015 2016 2017* 2012 2013 2014 2015 2016 2017* Strategic Acquisition Buyout IPO Strategic Acquisition Buyout IPO Source: Venture Pulse, Q2'17, Global Analysis of Venture Funding, KPMG Enterprise. *As of 6/30/2017. Data provided by PitchBook, July 13, 2017. Some long-awaited IPOs have finally occurred, yielding potential liquidity for a small crop of venture investors, yet acquisition via a strategic buyer remains by and large the most lucrative and frequently accessed exit route. © 2017 KPMG International Cooperative (“KPMG International”). KPMG International provides no client services and is a Swiss entity with which the independent member firms of the KPMG network are affiliated. #Q2VC
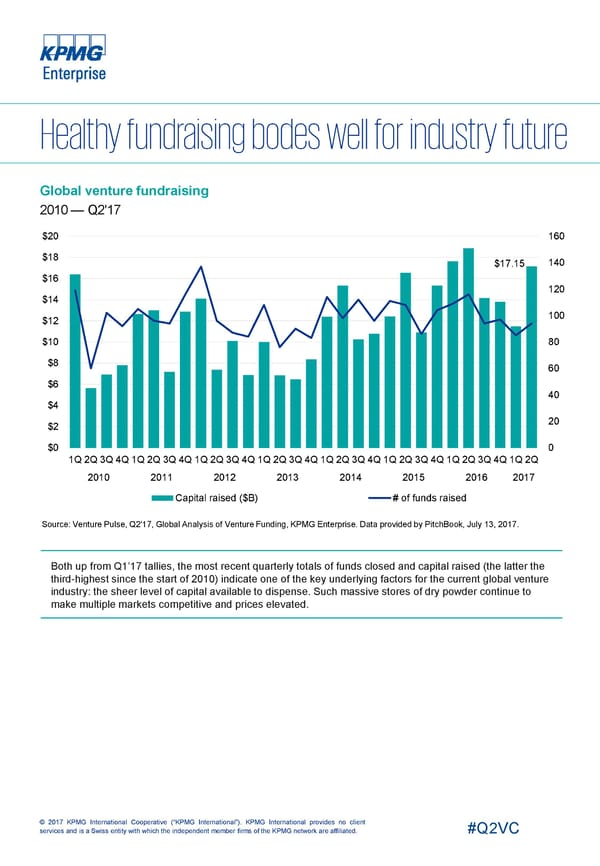
Global venture fundraising 2010 — Q2'17 $20 160 $18 140 $17.15 $16 120 $14 100 $12 $10 80 $8 60 $6 40 $4 20 $2 $0 0 1Q2Q3Q4Q1Q2Q3Q4Q1Q2Q3Q4Q1Q2Q3Q4Q1Q2Q3Q4Q1Q2Q3Q4Q1Q2Q3Q4Q1Q2Q 2010 2011 2012 2013 2014 2015 2016 2017 Capital raised ($B) # of funds raised Source: Venture Pulse, Q2'17, Global Analysis of Venture Funding, KPMG Enterprise. Data provided by PitchBook, July 13, 2017. Both up from Q1’17 tallies, the most recent quarterly totals of funds closed and capital raised (the latter the third-highest since the start of 2010) indicate one of the key underlying factors for the current global venture industry: the sheer level of capital available to dispense. Such massive stores of dry powder continue to make multiple markets competitive and prices elevated. © 2017 KPMG International Cooperative (“KPMG International”). KPMG International provides no client services and is a Swiss entity with which the independent member firms of the KPMG network are affiliated. #Q2VC
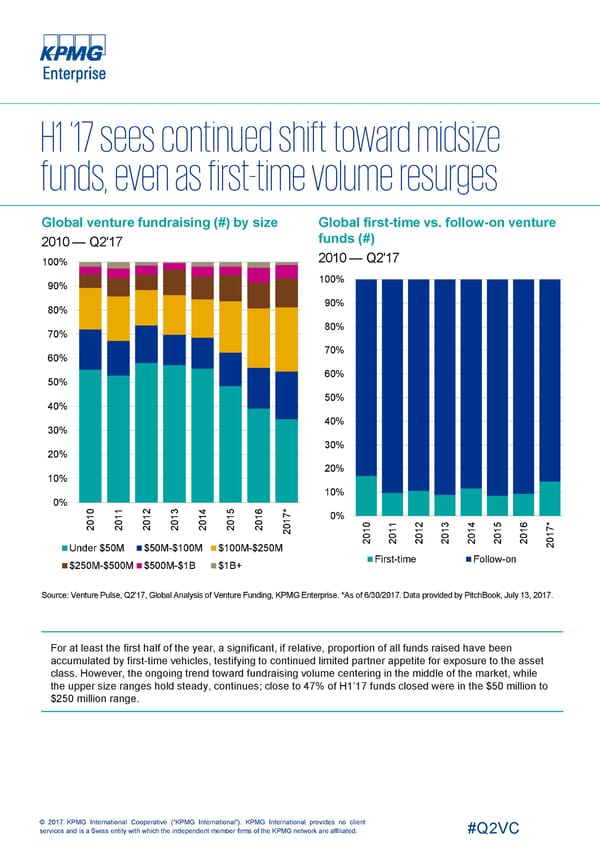
Global venture fundraising (#) by size Global first-time vs. follow-on venture funds (#) 2010 — Q2'17 2010 — Q2'17 100% 100% 90% 90% 80% 80% 70% 70% 60% 60% 50% 50% 40% 40% 30% 30% 20% 20% 10% 10% 0% 0 1 2 3 5 6 * 1 1 1 1 14 1 1 7 0% 0 0 0 0 0 0 1 * 0 0 1 2 3 4 5 6 2 2 2 2 20 2 2 7 2 1 1 1 1 1 1 1 0 0 0 0 0 0 0 1 2 2 2 2 2 2 2 0 2 Under $50M $50M-$100M $100M-$250M First-time Follow-on $250M-$500M $500M-$1B $1B+ Source: Venture Pulse, Q2'17, Global Analysis of Venture Funding, KPMG Enterprise. *As of 6/30/2017. Data provided by PitchBook, July 13, 2017. For at least the first half of the year, a significant, if relative, proportion of all funds raised have been accumulated by first-time vehicles, testifying to continued limited partner appetite for exposure to the asset class. However, the ongoing trend toward fundraising volume centering in the middle of the market, while the upper size ranges hold steady, continues; close to 47% of H1’17 funds closed were in the $50 million to $250 million range. © 2017 KPMG International Cooperative (“KPMG International”). KPMG International provides no client services and is a Swiss entity with which the independent member firms of the KPMG network are affiliated. #Q2VC
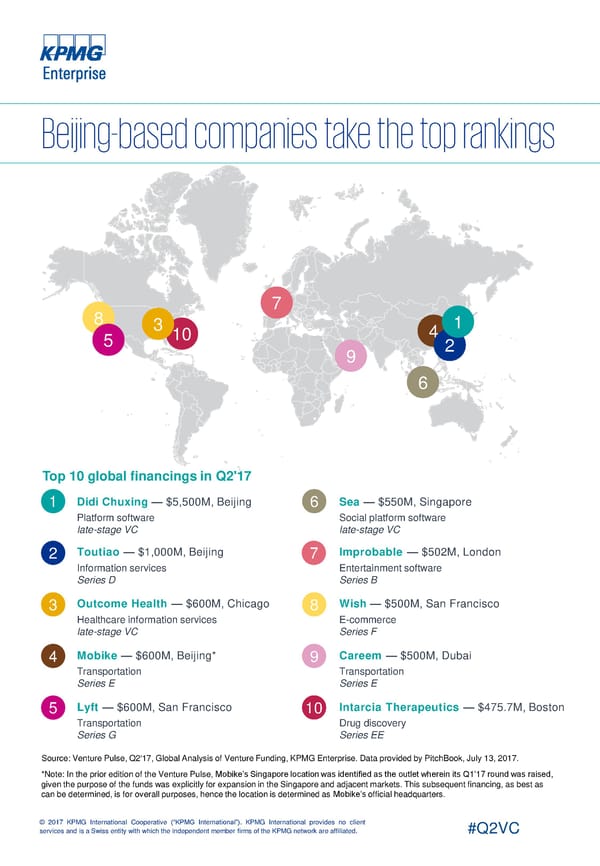
8 7 5 3 10 4 1 9 2 6 Top 10 global financings in Q2'17 1 Didi Chuxing — $5,500M, Beijing 6 Sea — $550M, Singapore Platform software Social platform software late-stage VC late-stage VC 2 Toutiao — $1,000M, Beijing 7 Improbable — $502M, London Information services Entertainment software Series D Series B 3 Outcome Health — $600M, Chicago 8 Wish — $500M, San Francisco Healthcare information services E-commerce late-stage VC Series F 4 Mobike — $600M, Beijing* 9 Careem —$500M, Dubai Transportation Transportation Series E Series E 5 Lyft — $600M, San Francisco 10 Intarcia Therapeutics — $475.7M, Boston Transportation Drug discovery Series G Series EE Source: Venture Pulse, Q2'17, Global Analysis of Venture Funding, KPMG Enterprise. Data provided by PitchBook, July 13, 2017. *Note: In the prior edition of the Venture Pulse, Mobike’s Singapore location was identified as the outlet wherein its Q1’17 round was raised, given the purpose of the funds was explicitly for expansion in the Singapore and adjacent markets. This subsequent financing, as best as can be determined, is for overall purposes, hence the location is determined as Mobike’s official headquarters. © 2017 KPMG International Cooperative (“KPMG International”). KPMG International provides no client services and is a Swiss entity with which the independent member firms of the KPMG network are affiliated. #Q2VC
