
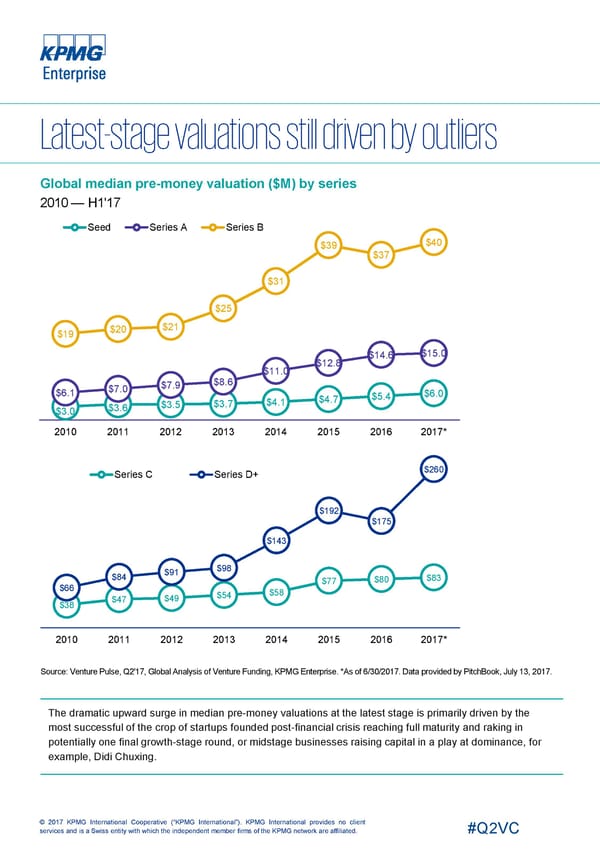
Global median pre-money valuation ($M) by series 2010 — H1'17 Seed Series A Series B $40 $39 $37 $31 $25 $21 $20 $19 $15.0 $14.6 $12.8 $11.0 $8.6 $7.9 $7.0 $6.1 $6.0 $5.4 $4.7 $4.1 $3.5 $3.7 $3.6 $3.0 2010 2011 2012 2013 2014 2015 2016 2017* $260 Series C Series D+ $192 $175 $143 $98 $91 $84 $83 $80 $77 $66 $58 $54 $49 $47 $38 2010 2011 2012 2013 2014 2015 2016 2017* Source: Venture Pulse, Q2'17, Global Analysis of Venture Funding, KPMG Enterprise. *As of 6/30/2017. Data provided by PitchBook, July 13, 2017. The dramatic upward surge in median pre-money valuations at the latest stage is primarily driven by the most successful of the crop of startups founded post-financial crisis reaching full maturity and raking in potentially one final growth-stage round, or midstage businesses raising capital in a play at dominance, for example, Didi Chuxing. © 2017 KPMG International Cooperative (“KPMG International”). KPMG International provides no client services and is a Swiss entity with which the independent member firms of the KPMG network are affiliated. #Q2VC
 Global Page 7 Page 9