
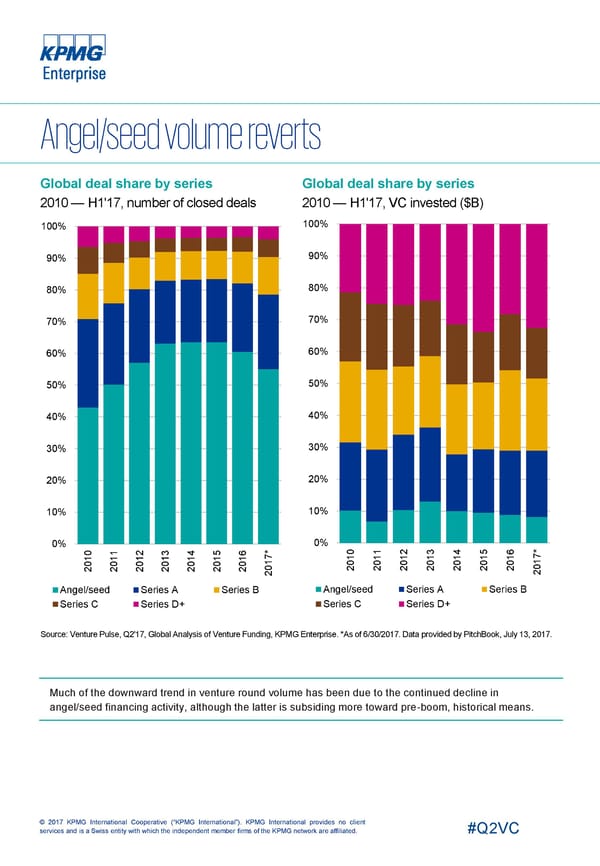
Global deal share by series Global deal share by series 2010 — H1'17, number of closed deals 2010 — H1'17, VC invested ($B) 100% 100% 90% 90% 80% 80% 70% 70% 60% 60% 50% 50% 40% 40% 30% 30% 20% 20% 10% 10% 0% 0% * 0 1 2 3 4 5 6 * 0 1 4 5 6 7 1 1 1 1 1 1 1 7 1 1 12 13 1 1 1 1 0 0 0 0 0 0 0 1 0 0 0 0 0 0 2 2 2 2 2 2 2 0 2 2 20 20 2 2 2 2 2 Angel/seed Series A Series B Angel/seed Series A Series B Series C Series D+ Series C Series D+ Source: Venture Pulse, Q2'17, Global Analysis of Venture Funding, KPMG Enterprise. *As of 6/30/2017. Data provided by PitchBook, July 13, 2017. Much of the downward trend in venture round volume has been due to the continued decline in angel/seed financing activity, although the latter is subsiding more toward pre-boom, historical means. © 2017 KPMG International Cooperative (“KPMG International”). KPMG International provides no client services and is a Swiss entity with which the independent member firms of the KPMG network are affiliated. #Q2VC
 Global Page 8 Page 10