
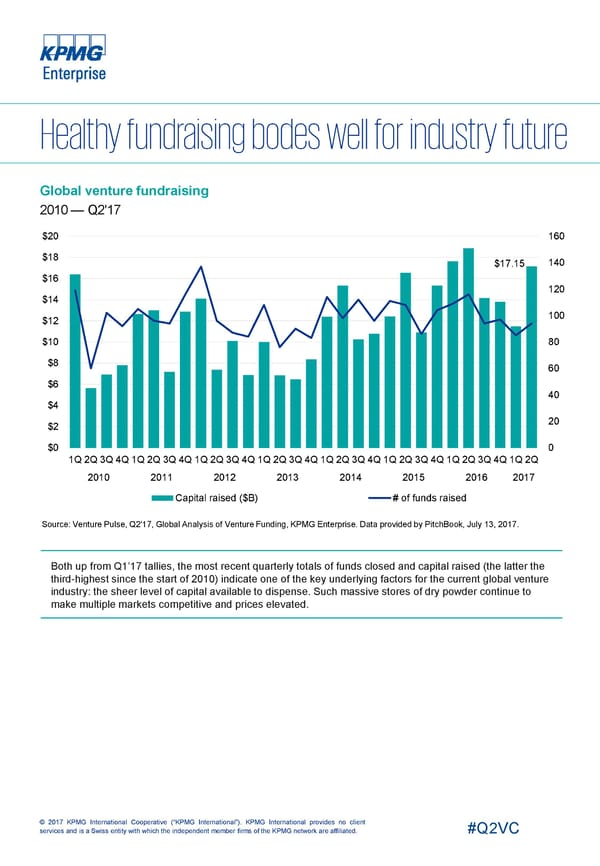
Global venture fundraising 2010 — Q2'17 $20 160 $18 140 $17.15 $16 120 $14 100 $12 $10 80 $8 60 $6 40 $4 20 $2 $0 0 1Q2Q3Q4Q1Q2Q3Q4Q1Q2Q3Q4Q1Q2Q3Q4Q1Q2Q3Q4Q1Q2Q3Q4Q1Q2Q3Q4Q1Q2Q 2010 2011 2012 2013 2014 2015 2016 2017 Capital raised ($B) # of funds raised Source: Venture Pulse, Q2'17, Global Analysis of Venture Funding, KPMG Enterprise. Data provided by PitchBook, July 13, 2017. Both up from Q1’17 tallies, the most recent quarterly totals of funds closed and capital raised (the latter the third-highest since the start of 2010) indicate one of the key underlying factors for the current global venture industry: the sheer level of capital available to dispense. Such massive stores of dry powder continue to make multiple markets competitive and prices elevated. © 2017 KPMG International Cooperative (“KPMG International”). KPMG International provides no client services and is a Swiss entity with which the independent member firms of the KPMG network are affiliated. #Q2VC
 Global Page 28 Page 30