
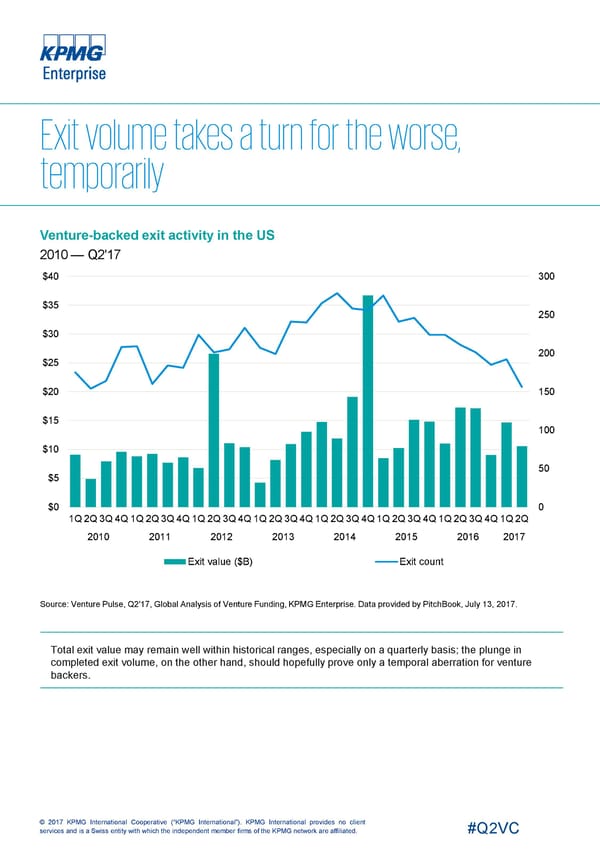
Venture-backed exit activity in the US 2010 — Q2'17 $40 300 $35 250 $30 200 $25 $20 150 $15 100 $10 50 $5 $0 0 1Q2Q3Q4Q1Q2Q3Q4Q1Q2Q3Q4Q1Q2Q3Q4Q1Q2Q3Q4Q1Q2Q3Q4Q1Q2Q3Q4Q1Q2Q 2010 2011 2012 2013 2014 2015 2016 2017 Exit value ($B) Exit count Source: Venture Pulse, Q2'17, Global Analysis of Venture Funding, KPMG Enterprise. Data provided by PitchBook, July 13, 2017. Total exit value may remain well within historical ranges, especially on a quarterly basis; the plunge in completed exit volume, on the other hand, should hopefully prove only a temporal aberration for venture backers. © 2017 KPMG International Cooperative (“KPMG International”). KPMG International provides no client services and is a Swiss entity with which the independent member firms of the KPMG network are affiliated. #Q2VC
 USA Page 13 Page 15