
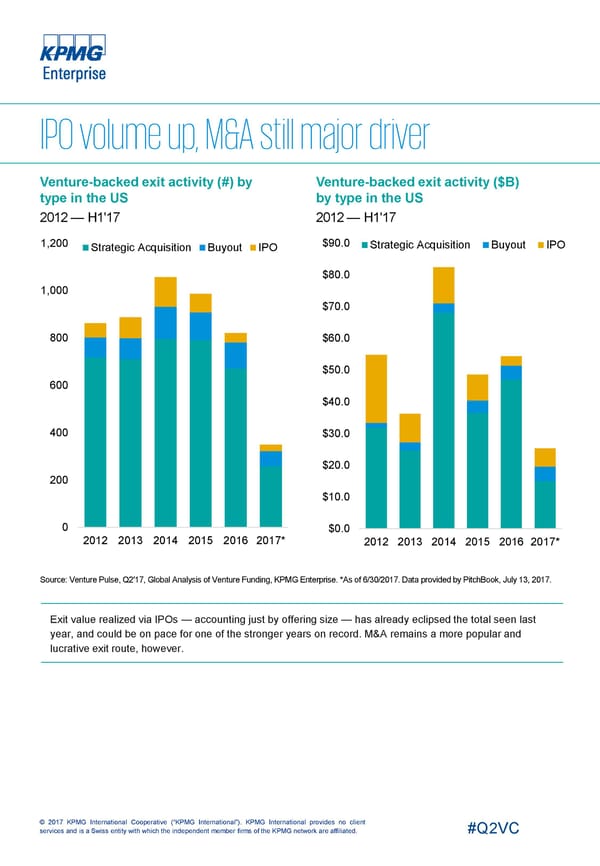
Venture-backed exit activity (#) by Venture-backed exit activity ($B) type in the US by type in the US 2012 — H1'17 2012 — H1'17 1,200 $90.0 Strategic Acquisition Buyout IPO Strategic Acquisition Buyout IPO $80.0 1,000 $70.0 800 $60.0 $50.0 600 $40.0 400 $30.0 $20.0 200 $10.0 0 $0.0 2012 2013 2014 2015 2016 2017* 2012 2013 2014 2015 2016 2017* Source: Venture Pulse, Q2'17, Global Analysis of Venture Funding, KPMG Enterprise. *As of 6/30/2017. Data provided by PitchBook, July 13, 2017. Exit value realized via IPOs — accounting just by offering size — has already eclipsed the total seen last year, and could be on pace for one of the stronger years on record. M&A remains a more popular and lucrative exit route, however. © 2017 KPMG International Cooperative (“KPMG International”). KPMG International provides no client services and is a Swiss entity with which the independent member firms of the KPMG network are affiliated. #Q2VC
 USA Page 14 Page 16