
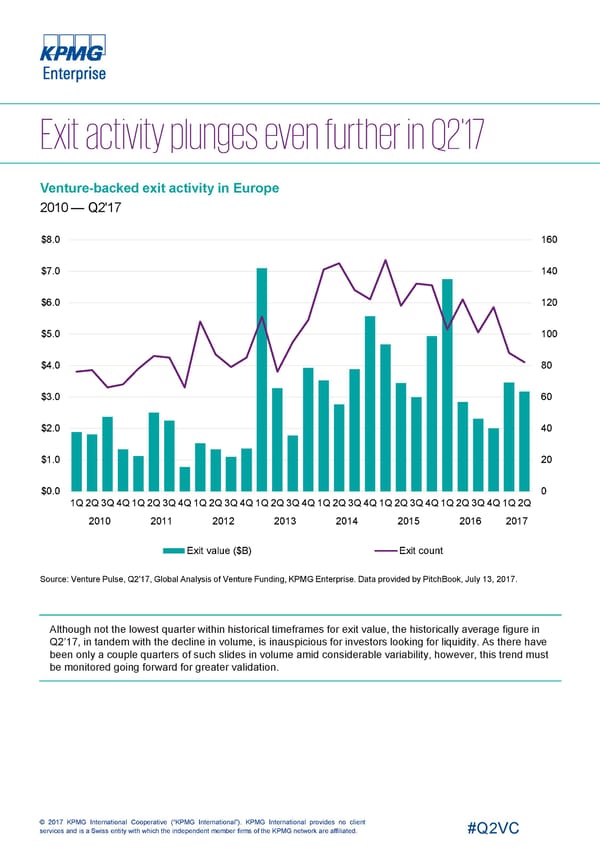
Venture-backed exit activity in Europe 2010 — Q2'17 $8.0 160 $7.0 140 $6.0 120 $5.0 100 $4.0 80 $3.0 60 $2.0 40 $1.0 20 $0.0 0 1Q2Q3Q4Q1Q2Q3Q4Q1Q2Q3Q4Q1Q2Q3Q4Q1Q2Q3Q4Q1Q2Q3Q4Q1Q2Q3Q4Q1Q2Q 2010 2011 2012 2013 2014 2015 2016 2017 Exit value ($B) Exit count Source: Venture Pulse, Q2'17, Global Analysis of Venture Funding, KPMG Enterprise. Data provided by PitchBook, July 13, 2017. Although not the lowest quarter within historical timeframes for exit value, the historically average figure in Q2’17, in tandem with the decline in volume, is inauspicious for investors looking for liquidity. As there have been only a couple quarters of such slides in volume amid considerable variability, however, this trend must be monitored going forward for greater validation. © 2017 KPMG International Cooperative (“KPMG International”). KPMG International provides no client services and is a Swiss entity with which the independent member firms of the KPMG network are affiliated. #Q2VC
 Europe Page 12 Page 14